Description
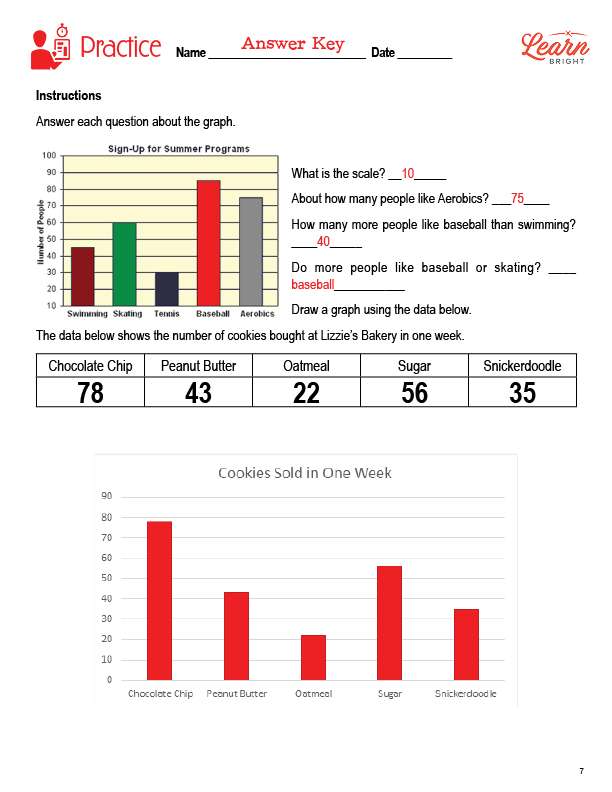
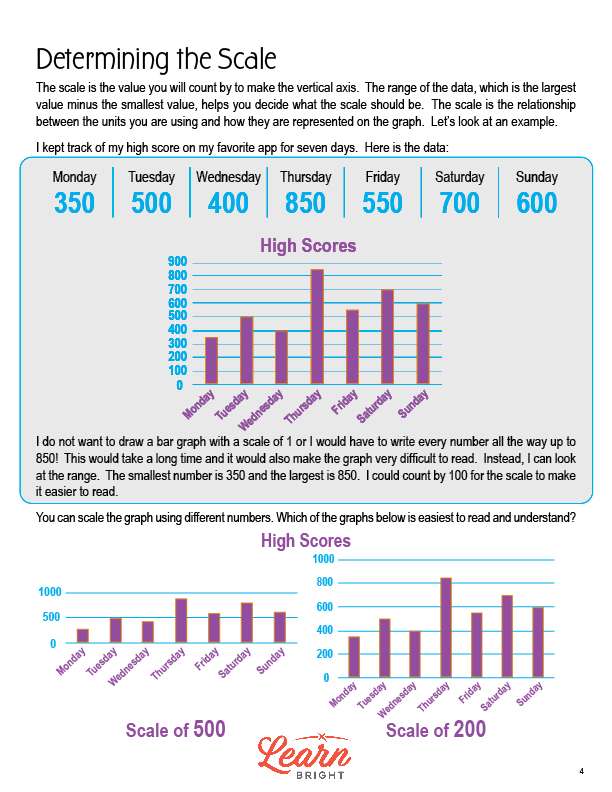
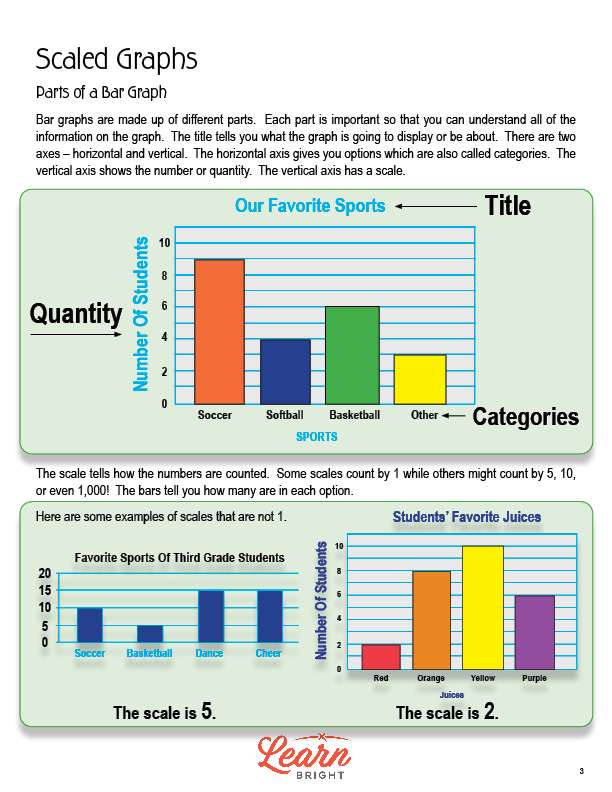
Our Scaled Graphs lesson plan teaches students about bar graphs, including why they are scaled and what that means, how to read them, and how to create them. During this lesson, students are asked to create their own bar graphs using the answers to a question they come up with and ask their class. Students are also asked to look at a bar graph and answer questions about it.
At the end of the lesson, students will be able to draw a scaled bar graph to represent data and solve problems using the information presented in the scaled graph.
