
Description
What our Measuring Numerical Data lesson plan includes
Lesson Objectives and Overview: Measuring Numerical Data lesson plan teaches students about a number of ways to measure numerical data, such as mean, median, mode, and more. At the end of the lesson, students will be able to recognize that a measure of center summarizes all of its values with a single number while a measure of variation describes how the values vary with a single number. This lesson is for students in 6th grade.
Classroom Procedure
Every lesson plan provides you with a classroom procedure page that outlines a step-by-step guide to follow. You do not have to follow the guide exactly. The guide helps you organize the lesson and details when to hand out worksheets. It also lists information in the blue box that you might find useful. You will find the lesson objectives, state standards, and number of class sessions the lesson should take to complete in this area. In addition, it describes the supplies you will need as well as what and how you need to prepare beforehand.
Options for Lesson
Included with this lesson is an “Options for Lesson” section that lists a number of suggestions for activities to add to the lesson or substitutions for the ones already in the lesson. One optional adjustment to this lesson is to have your students use a data set from online rather than collecting data as a class. You could also have each student bring in one stuffed animal to measure instead of the letters in their names. Finally, try using an online display to show the collected data on screen in real time.
Teacher Notes
The teacher notes page includes a paragraph with additional guidelines and things to think about as you begin to plan your lesson. This page also includes lines that you can use to add your own notes as you’re preparing for this lesson.
MEASURING NUMERICAL DATA LESSON PLAN CONTENT PAGES
Measuring Numerical Data
The Measuring Numerical Data lesson plan includes two content pages.
Measure of Center
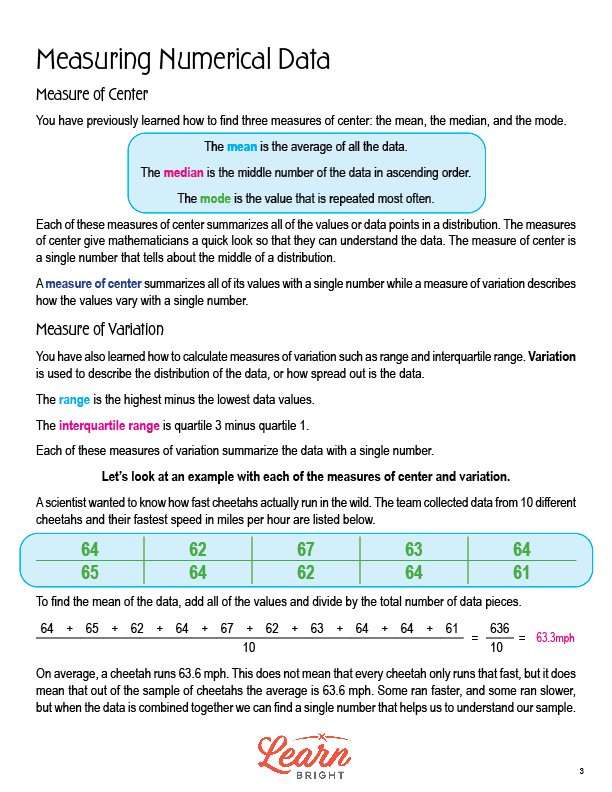
You likely already know how to find three measures of center: the mean, the median, and the mode. To recap, the mean is the average of all the data, the median is the middle number of the data in ascending order, and the mode is the value that is repeated most often.
These measurements all summarize all of the values or data points in a distribution. Measures of center allow mathematicians to take a quick look to understand their data. A measure of center is a single number that tells you about the middle of a distribution. Measures of center summarize all of its values with a single number while a measure of variation describes how the values vary with a single number.
Measure of Variation
You may already know how to calculate range and interquartile range, which are measures of variation. Variation refers to the distribution of the data, or how spread out the data is. To recap, the range is the highest minus the lowest data values and the interquartile range is quartile 3 minus quartile 1. These measures of variation summarize the data with a single number.
Examples
The lesson next walks students through an example of each measure of center and variation using a data set containing data from 10 different cheetahs and their fastest speed in miles per hour. The data set includes: 64, 62, 67, 63, 64, 65, 64, 62, 64, and 61.
To find the mean, we add all of the values and then divide by the total number of data points. When we add the values together, we get 636. We then divide that number by 10, which is the total number of data points. 636/10 = 63.6, so the mean is 63.6mph. This means that, on average, a cheetah runs at a speed of 63.6mph. However, this does not mean that all cheetahs run at that speed all of the time. Some cheetahs run faster and some run slower! This number simply helps us understand our sample.
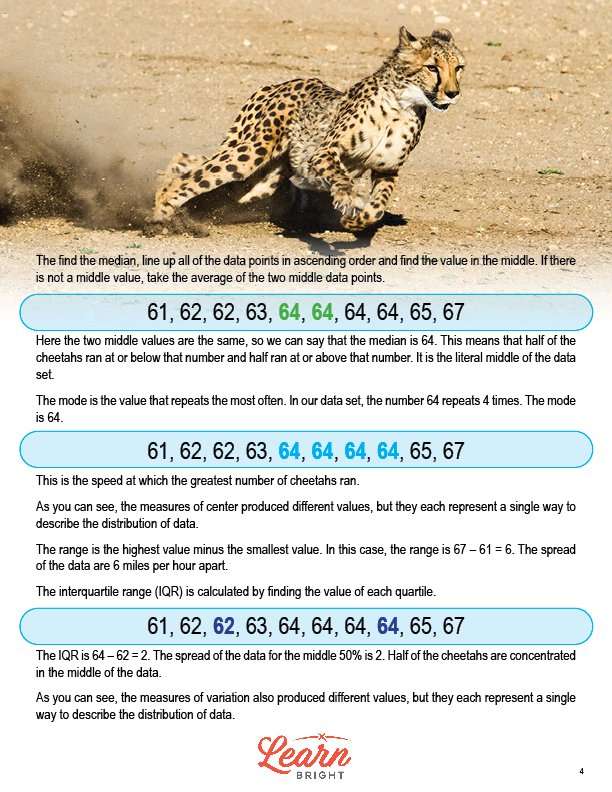
To find the median, we put all of the data points in order from smallest to largest and find the value in the middle. The values in order are: 61, 62, 62, 63, 64, 64, 64, 64, 65, 67. This data set has two middle values since there are an even number of values. The two middle values are 64 and 64. Since they’re the same, the median is 64. If they were different, we would need to find the mean of the two middle values.
To find the mode, we determine which value repeats the most often. In this data set, the number 64 repeats four times, which is the most of any value. The mode is 64. This is the speed at which most cheetahs ran.
The different measures of center gave us different values, and each tells us something different about the data set.
To find the range, we subtract the smallest value from the largest value. For this data set, the smallest value is 61 and the largest value is 67, so we subtract 67 – 61 = 6. The range is 6. This tells us that the spread of the data are 6 miles per hour apart.
Finally, to find the interquartile range (IQR) , we find the value of each quartile. The IQR is 64 – 62 = 2. This tells us that the spread of the data for the middle 50% is 2. Therefore, half of the cheetahs are concentrated in the middle of the data.
Like the measures of center, the different measures of variation gave us different values, and each tells us something different about the distribution of data for our data set.
MEASURING NUMERICAL DATA LESSON PLAN WORKSHEETS
The Measuring Numerical Data lesson plan includes three worksheets: an activity worksheet, a practice worksheet, and a homework assignment. You can refer to the guide on the classroom procedure page to determine when to hand out each worksheet.
FIRST NAMES ACTIVITY WORKSHEET
For the activity worksheet, students will count the number of letters in your first and last name and record the data in the chart on the worksheet. Next, they will find nine of their classmates and record the number of letters in their names. Finally, they will find the mean, median, mode, range, and interquartile range of the class data.
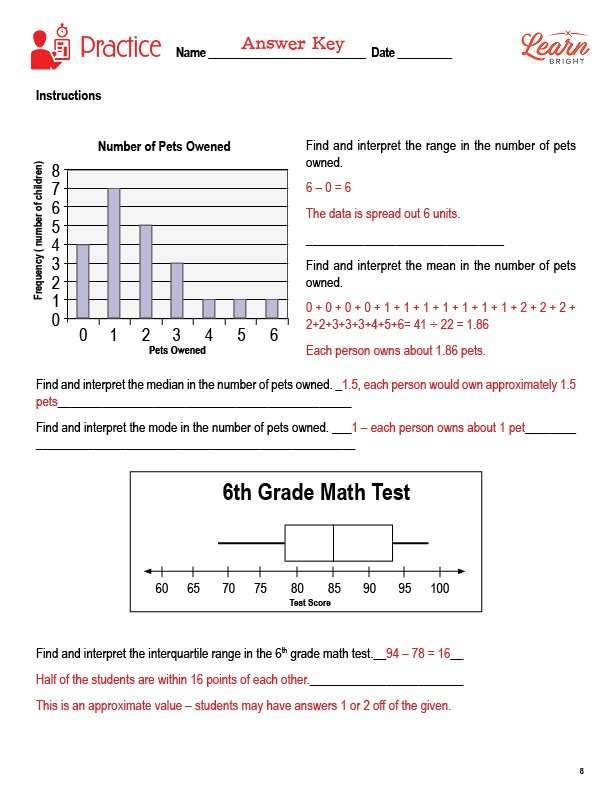
GRAPHS PRACTICE WORKSHEET
The practice worksheet asks students to first analyze a bar graph and find and interpret the range and mean of the data. They will then analyze a box plot and find and interpret the interquartile range of the data.
MEASURING NUMERICAL DATA HOMEWORK ASSIGNMENT
For the homework assignment, students will measure 10 of their stuffed animals (or other toys) in inches and record the data in the chart on the worksheet. They will then find the mean, median, mode, range, and interquartile range of the data.
Worksheet Answer Keys
This lesson plan includes answer keys for the practice worksheet and the homework assignment. If you choose to administer the lesson pages to your students via PDF, you will need to save a new file that omits these pages. Otherwise, you can simply print out the applicable pages and keep these as reference for yourself when grading assignments.