

Description
What our Measures of Center lesson plan includes
Lesson Objectives and Overview: Measures of Center lesson plan will give your students the knowledge to determine the mean, median, mode and range of a set of numbers. The lesson includes an activity which requires students to collect data, helping you to easily connect this lesson to a science lesson as well as math. At the end of the lesson, students will be able to calculate and apply measures of center to sets of data. This lesson is for students in 4th grade, 5th grade, and 6th grade.
Classroom Procedure
Every lesson plan provides you with a classroom procedure page that outlines a step-by-step guide to follow. You do not have to follow the guide exactly. The guide helps you organize the lesson and details when to hand out worksheets. It also lists information in the blue box that you might find useful. You will find the lesson objectives, state standards, and number of class sessions the lesson should take to complete in this area. In addition, it describes the supplies you will need as well as what and how you need to prepare beforehand.
Options for Lesson
Included with this lesson is an “Options for Lesson” section that lists a number of suggestions for activities to add to the lesson or substitutions for the ones already in the lesson. One optional addition to this lesson is to have your students collect data in various stations set up around the room, such as their heart rates, hand grabs, and jumping jacks; you can then have your students calculate the data as a homework assignment. You could also have your students create their own charts based on their data to create an inclusive project with the statistics unit.
Teacher Notes
The teacher notes page includes lines that you can use to add your own notes as you’re preparing for this lesson.
MEASURES OF CENTER LESSON PLAN CONTENT PAGES
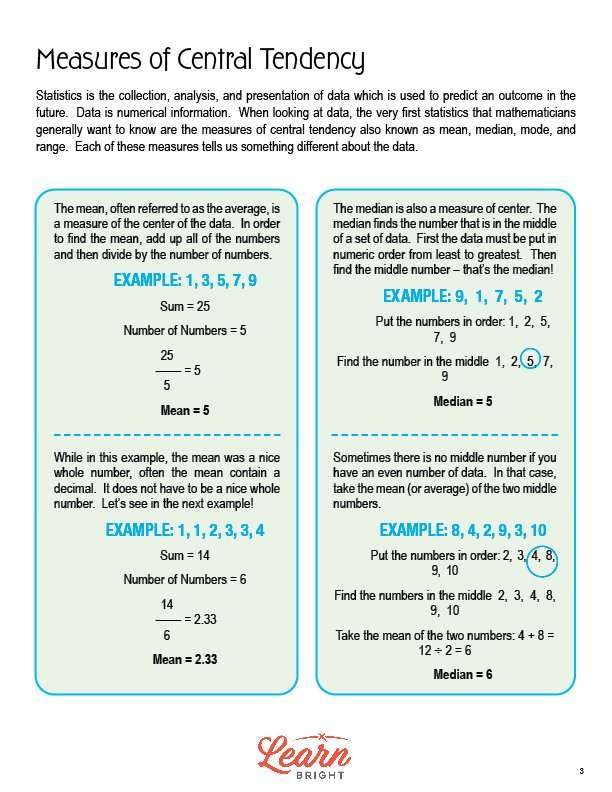
Measures of Central Tendency
The Measures of Center lesson plan includes two content pages. We use statistics to predict an outcome in the future using the collection, analysis, and presentation of data (numerical information). Mathematicians, when looking at data, usually first look at the measures of central tendency also known as mean, median, mode, and range. These measures all tell us different things about the data.
Mean
The mean, or the average, measures the center of the data. To find the mean, we add up all of the numbers and divide by the total number of numbers. For example, to find the mean of 1, 3, 5, 7, and 9, we first add the numbers together to get 25. We then divide 25 by the total number of numbers, 5, to get a mean of 5.
The mean is not always a whole number. It can sometimes contain a decimal. For example, say we wanted to find the mean of 1, 1, 2, 3, 3, and 4. We first add the numbers together to get a sum of 14. Next, we divide the sum by the total number of numbers, 6. 14 divided by 6 is 2.33, so our mean is 2.33.
Median
The median also measures the center, but in a different way. It finds the number that is in the middle of a set of data. To find the median, we put the data in order from least to greatest and find the middle number. For example, to find the median of 9, 1, 7, 5, 2, we first put them in order: 1, 2, 5, 7, 9. We then find the middle number, which is 5, to get a median of 5.
If you have an even number of numbers in your data set, there isn’t a single middle number for your median. When this happens, we take the mean of the two middle numbers instead. For example, say we wanted to find the median of : 8, 4, 2, 9, 3, 10. First, we put the numbers in order: 2, 3, 4, 8, 9, 10. Next, we find the two numbers in the middle: 4 and 8. Finally, we find the mean of the two middle numbers: 4 + 8 = 12 / 2 = 6. The median for this data set is 6.
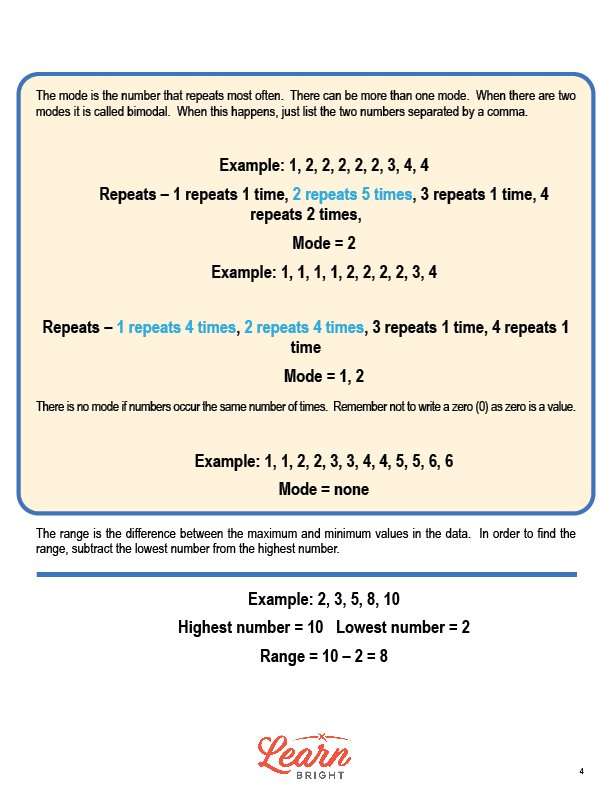
Mode
The mode is the number in a data set that repeats most often. For example, to find the mode of 1, 2, 2, 2, 2, 2, 3, 4, 4, we simply count each number. When we do this, we find that 1 repeats one time, 2 repeats five times, 3 repeats one time, and 4 repeats two times. Since 2 repeats the most times, the mode is 2.
Data sets can have more than one mode. If it has more than one, we call it bimodal and list both numbers separated by a comma. For example, to find the mode of 1, 1, 1, 1, 2, 2, 2, 2, 3, 4, we count each number and find that 1 repeats four times, 2 repeats four times, 3 repeats one time, and 4 repeats one time. Since both 1 and 2 repeat the most times, the mode is 1, 2.
If every number repeats the same number of times, there is no mode. Remember not to write a 0 when there is no mode, as 0 is a value! For example, each number in the data set 1, 1, 2, 2, 3, 3, 4, 4, 5, 5, 6, 6 repeats twice, so there is no mode.
Range
The range is the difference between the maximum and minimum values in your data set. To find the range, we simply subtract the lowest number from the highest number. For example, to find the range of 2, 3, 5, 8, 10, we subtract the lowest number (2) from the highest number (10). 10 – 2 = 8, so 8 is the range.
MEASURES OF CENTER LESSON PLAN WORKSHEETS
The Measures of Center lesson plan includes four worksheets: an activity worksheet, a practice worksheet, a homework assignment, and a quiz. You can refer to the guide on the classroom procedure page to determine when to hand out each worksheet.
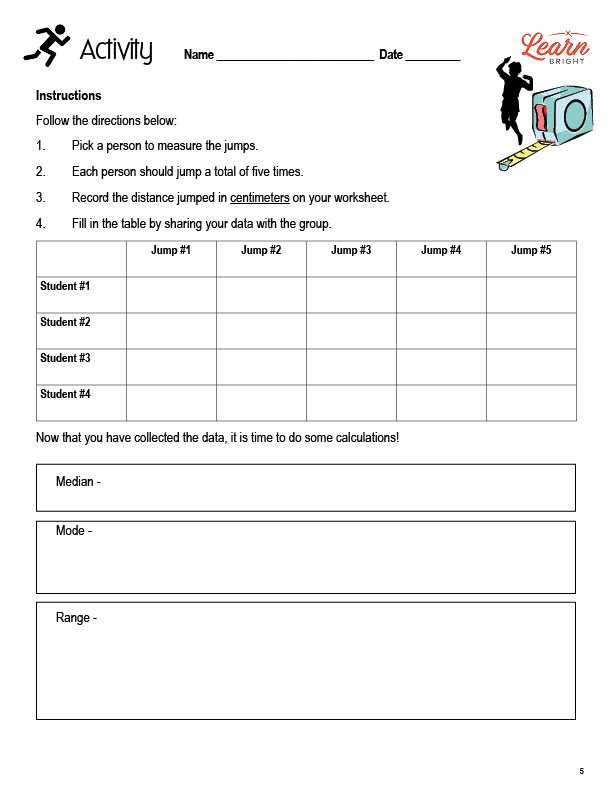
JUMPS ACTIVITY WORKSHEET
Students will work in groups to complete the lesson activity. Each student will jump a total of five times, and one person in each group will measure everyone’s jumps in centimeters. Students will fill in the table on the worksheet with everyone’s data. Finally, they will calculate the median, mean, and range of the group’s jumps.
MEAN, MEDIAN, MODE, AND RANGE PRACTICE WORKSHEET
For the practice worksheet, students will find the mean, median, mode, and range of different sets of numbers.
MEASURES OF CENTER HOMEWORK ASSIGNMENT
The homework assignment asks students to first use a computer or an app to find the 5-day weather forecast for their area. They will write down the high and low temperatures for each day. They will then find the mean, median, mode, and range of both the high and low temperatures.
QUIZ
This lesson also includes a quiz that you can use to test students’ understanding of the lesson material. For the quiz, students will solve four problems and circle the correct answer for each.
Worksheet Answer Keys
This lesson plan includes answer keys for the practice worksheet and the quiz. If you choose to administer the lesson pages to your students via PDF, you will need to save a new file that omits these pages. Otherwise, you can simply print out the applicable pages and keep these as reference for yourself when grading assignments.