

Description
What our Graph Inequalities on Number Lines lesson plan includes
Lesson Objectives and Overview: Graph Inequalities on Number Lines teaches students how to graph inequalities on a number line. At the end of the lesson, students will be able to graph inequalities on a number line. This lesson is for students in 6th grade.
Classroom Procedure
Every lesson plan provides you with a classroom procedure page that outlines a step-by-step guide to follow. You do not have to follow the guide exactly. The guide helps you organize the lesson and details when to hand out worksheets. It also lists information in the blue box that you might find useful. You will find the lesson objectives, state standards, and number of class sessions the lesson should take to complete in this area. In addition, it describes the supplies you will need as well as what and how you need to prepare beforehand. Some of the supplies you will need for this lesson include scissors, extra paper, and glue.
Options for Lesson
Included with this lesson is an “Options for Lesson” section that lists a number of suggestions for activities to add to the lesson or substitutions for the ones already in the lesson. One optional addition to this lesson is to have your students use a die to roll a number and then graph on a number line. To add to the practice worksheet, you could have students draw outside with chalk using their practice problems. If you’d like to add additional content to the lesson, you can incorporate solving one step inequalities with graphing. Finally, you could demonstrate how to graph two inequalities on a single number line using two different colors to help students prepare for algebra.
Teacher Notes
The teacher notes page includes a paragraph with additional guidelines and things to think about as you begin to plan your lesson. This page also includes lines that you can use to add your own notes as you’re preparing for this lesson.
GRAPH INEQUALITIES ON NUMBER LINES LESSON PLAN CONTENT PAGES
Graph Inequalities on Number Lines
The Graph Inequalities on Number Lines lesson plan includes two pages of content. You sole inequalities just like you solve equations. However, they are different in two key ways. First, inequalities and equations use different symbols. Second, when you solve an inequality you find all of its solutions. The solutions for inequalities are sets of numbers which, when you substitute them in for the variables, make the inequality a true statement.
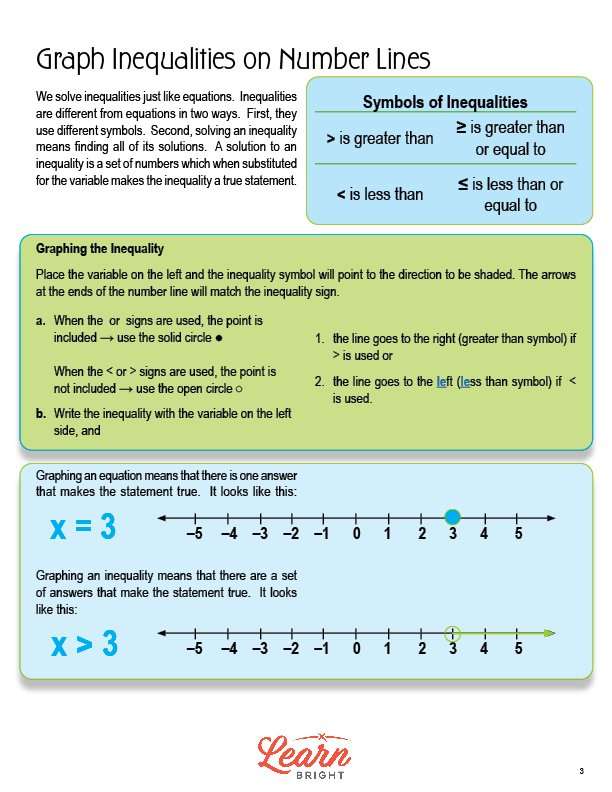
The symbols of inequalities are > (greater than), < (less than), ≥ (greater than or equal to), and ≤ (less than or equal to).
Graphing the Inequality
To graph an inequality, place the variable on the left and point the inequality in the direction to be shaded. The arrows at either end of the number line match the inequality sign.
When using the ≥ or ≤ symbols, the point is included. You use a closed (solid) circle on the number line to show that the point is included. When using the > or < symbols, the point is not included. You use an open (not solid) circle to show that the point is not included. Always make sure to write the inequality with the variable on the left side of the number line. The line goes to the right if it uses > and to the left if it uses <.
When you graph an equation, there is one right answer. When you graph an inequality, there are a set of answers. The lesson shows examples of what both look like on a number line.
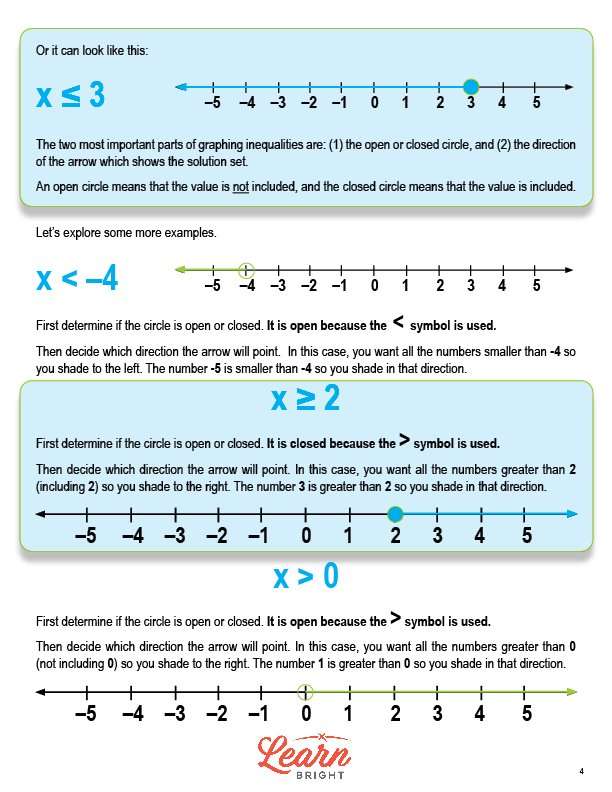
The two most important things to pay attention to when graphing inequalities are whether the circle is open or closed and the direction of the arrow.
The lesson closes with a few examples. For the inequality x ≥ 2, the first step is to decide whether the circle is open or closed. The circle is closed because the ≥ symbol is used. Next, decide which direction the arrow needs to point. For this inequality, you want all numbers greater than 2 (including 2) so your arrow should point to the right. The number 3 is greater than 2, so you shade in that direction.
For the inequality x > 0, first decide whether the circle is open or closed. The circle is open because the > symbol is used. Next, decide which direction the arrow goes in. For this inequality, you want all the numbers greater than 0 (not including 0) so you shade to the right. The number 1 is greater than 0, so you shade in that direction.
GRAPH INEQUALITIES ON NUMBER LINES LESSON PLAN WORKSHEETS
The Graph Inequalities on Number Lines lesson plan includes four worksheets: an activity worksheet, a practice worksheet, a homework assignment, and a quiz. You can refer to the guide on the classroom procedure page to determine when to hand out each worksheet.
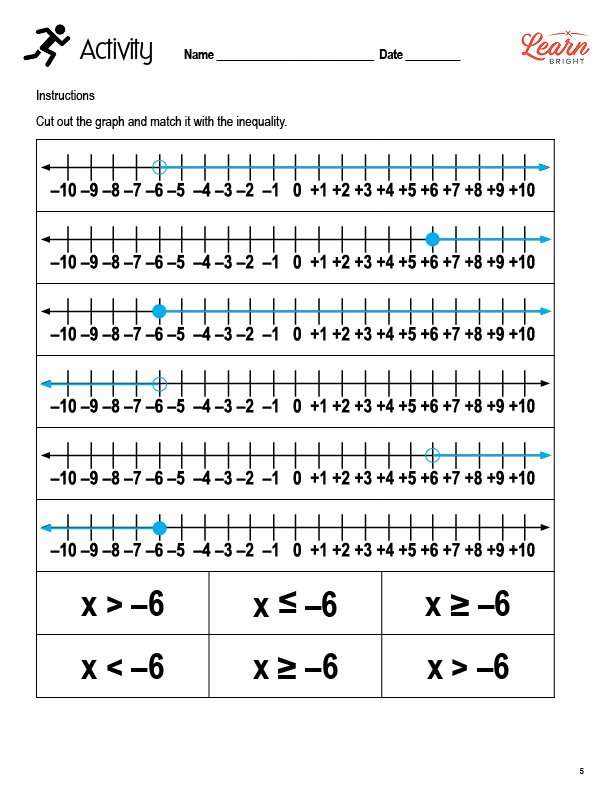
MATCHING ACTIVITY WORKSHEET
For the activity worksheet, students will cut out each graph printed on the worksheet and match them with the correct inequality.
GRAPH INEQUALITIES ON NUMBER LINES PRACTICE WORKSHEET
The practice worksheet asks students to graph nine inequalities on the number lines on the worksheet.
WRITING INEQUALITIES HOMEWORK ASSIGNMENT
For the homework assignment, students will write an inequality for each of the seven graphs shown on the worksheet.
QUIZ
This lesson also includes a quiz that you can use to test students’ understanding of the lesson material. For the quiz, students will fill in the blanks in several questions about the lesson material. They will then graph the inequality x > -8.
Worksheet Answer Keys
This lesson plan includes answer keys for the practice worksheet, the homework assignment, and the quiz. If you choose to administer the lesson pages to your students via PDF, you will need to save a new file that omits these pages. Otherwise, you can simply print out the applicable pages and keep these as reference for yourself when grading assignments.