

Description
What our Dot Plots lesson plan includes
Lesson Objectives and Overview: Dot Plots introduces students to dot plots, a graphical representation of data using dots where the data is plotted on a number line using a scale of your choice. At the end of the lesson, students will be able to construct dot plots and interpret the data presented in the dot plot. This lesson is for students in 6th grade.
Classroom Procedure
Every lesson plan provides you with a classroom procedure page that outlines a step-by-step guide to follow. You do not have to follow the guide exactly. The guide helps you organize the lesson and details when to hand out worksheets. It also lists information in the blue box that you might find useful. You will find the lesson objectives, state standards, and number of class sessions the lesson should take to complete in this area. In addition, it describes the supplies you will need as well as what and how you need to prepare beforehand.
Options for Lesson
Included with this lesson is an “Options for Lesson” section that lists a number of suggestions for activities to add to the lesson or substitutions for the ones already in the lesson. One optional addition to this lesson is to have your students use a computer to create their dot plots. You could also have your students generate data collection questions as small groups and poll various classes in the school and then compare them. Finally, you can have students ask teachers and administrators and compare them with the student body or their class.
Teacher Notes
The teacher notes page includes lines that you can use to add your own notes as you’re preparing for this lesson.
DOT PLOTS LESSON PLAN CONTENT PAGES
Dot Plots
The Dot Plots lesson plan includes two pages of content. Dot plots are graphical representations of data using dots. You plot the data on a number line using a scale that you choose. On these graphs, each dot represents a single value and stack on top of each other to create columns. The higher the column, the higher the frequency of observation.
We can use dot plots for univariate data, which is data that measures only one (uni-) variable, categorical data, which can be organized into categories (i.e., hair color, sports, types of vegetables), or quantitative variables which can be measured or has a specific numerical value (i.e., height, weight, number of people).
It’s best to use dot plots when you have smaller amounts of data, because each dot represents a single value. Imagine trying to make sense of a dot plot with a million dots on it!
Creating a Dot Plot
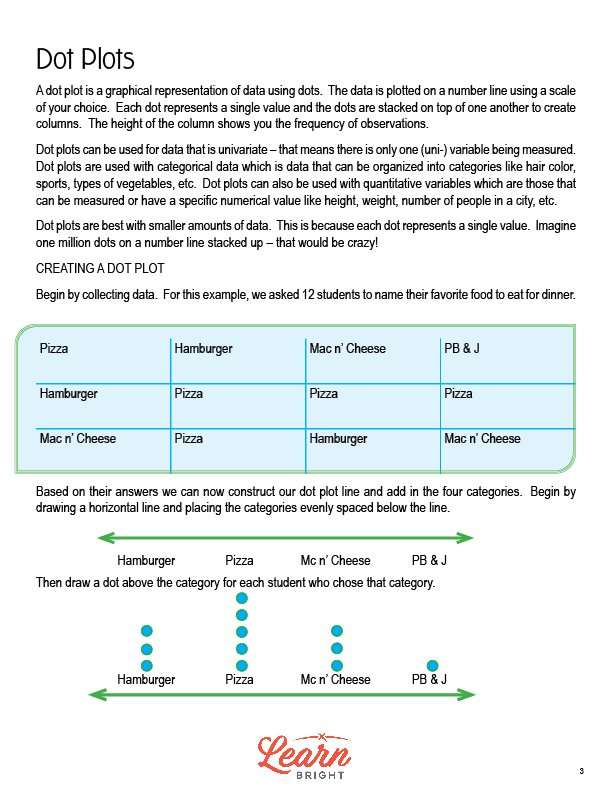
To create a dot plot, you first need to collect data. The lesson shows an example where 12 students named their favorite food to eat for dinner. We can construct a dot plot line using those answers. To do this, we first draw a horizontal line and place the categories (in this case, different foods) evenly spaced below the line. Next, we draw a dot above each category for each student who chose that category.
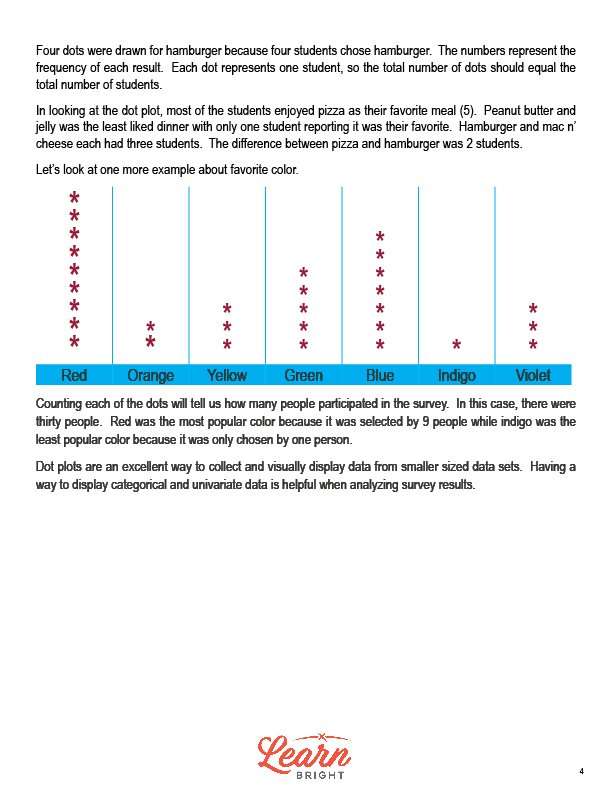
Because four students chose hamburgers, we draw four dots above the hamburger category. The number of dots represent the frequency of each result, and each dot represents one student. The total number of dots should equal the total number of students. When we look at the completed dot plot, we can see that the most number of students like pizza best.
The lesson closes with a second example using favorite colors. It shows the dot plot and explains how to interpret it to figure out which colors are more popular than others. Dot plots are a great way to collect and display small data sets. They can display both categorical and univariate data, which is helpful when you need to analyze survey results.
DOT PLOTS LESSON PLAN WORKSHEETS
The Dot Plots lesson plan includes four worksheets: an activity worksheet, a practice worksheet, a homework assignment, and a quiz. You can refer to the guide on the classroom procedure page to determine when to hand out each worksheet.
COLLECTING DATA ACTIVITY WORKSHEET
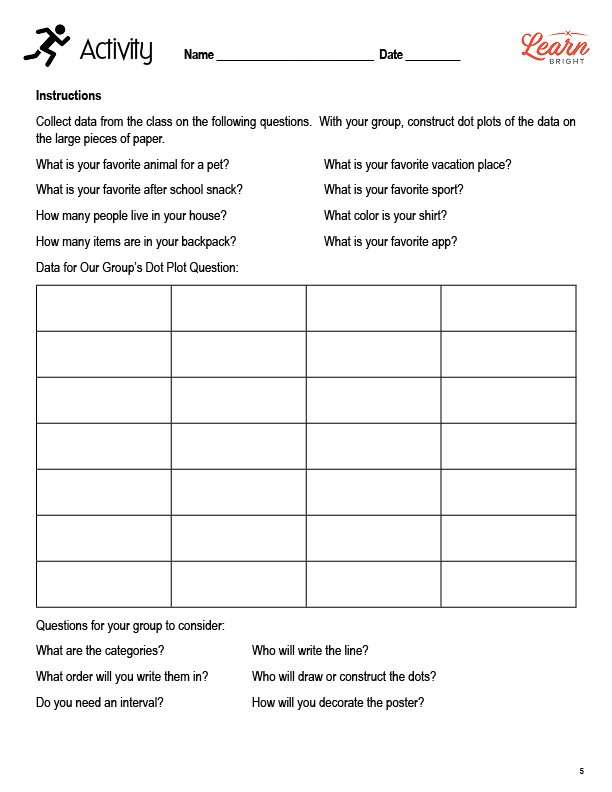
For the activity worksheet, students will work in groups to collect data from their class using the list of questions on the worksheet. Each group will then create dot plots of the data. They will consider different questions while constructing their dot plots, such as What are the categories? and What order will you write them in?
GIRL SCOUT COOKIES PRACTICE WORKSHEET
The practice worksheet asks students to look at the dot plot on the worksheet, which shows the number of girl scout cookies sold in one week by a girl scout, and answer questions about it.
DOT PLOTS HOMEWORK ASSIGNMENT
For the homework assignment, students will collect data from 10 people in their neighborhood. They will ask the three questions included on the worksheet and will create a fourth question to ask. They will then use the data they collect to construct dot plots.
QUIZ
This lesson also includes a quiz that you can use to test students’ understanding of the lesson material. For the quiz, students will look at a dot plot, analyze it, and answer questions about it.
Worksheet Answer Keys
This lesson plan includes answer keys for the practice worksheet and the quiz. If you choose to administer the lesson pages to your students via PDF, you will need to save a new file that omits these pages. Otherwise, you can simply print out the applicable pages and keep these as reference for yourself when grading assignments.