

Description
What our Describing Numerical Data lesson plan includes
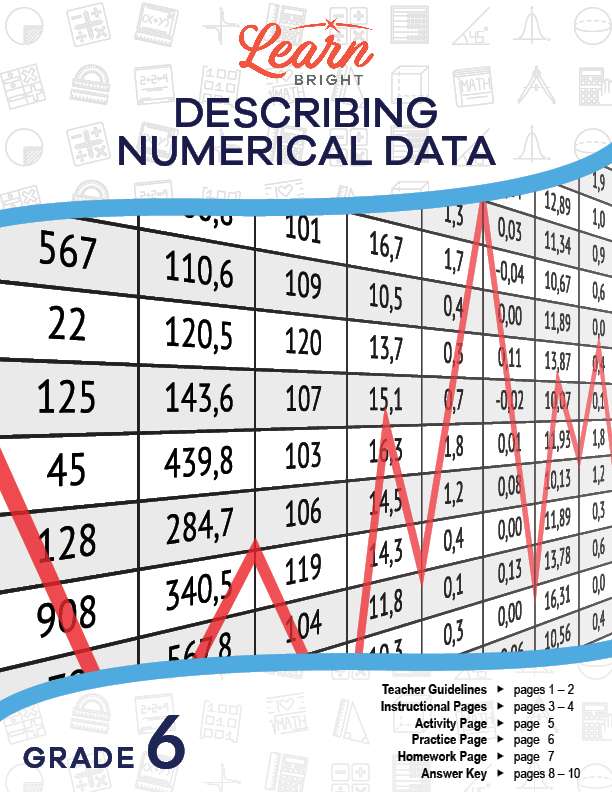
Lesson Objectives and Overview: Describing Numerical Data teaches students how to describe numerical data and discusses why being able to describe numerical data is necessary for mathematics. At the end of the lesson, students will be able to describe the attribute under investigation such as how it was measured and the units of measurement. This lesson is for students in 6th grade.
Classroom Procedure
Every lesson plan provides you with a classroom procedure page that outlines a step-by-step guide to follow. You do not have to follow the guide exactly. The guide helps you organize the lesson and details when to hand out worksheets. It also lists information in the blue box that you might find useful. You will find the lesson objectives, state standards, and number of class sessions the lesson should take to complete in this area. In addition, it describes the supplies you will need as well as what and how you need to prepare beforehand. The supplies you will need for this lesson include yard sticks, a scale, and a computer.
Options for Lesson
Included with this lesson is an “Options for Lesson” section that lists a number of suggestions for activities to add to the lesson or substitutions for the ones already in the lesson. One optional addition to the lesson is to have your students develop their own question and determine the route they will take to research it. You could also use actual studies to help students connect with other disciplines and have a deeper look into designing a research study. Finally, you can ask the class to work together to design a research project that would help the school.
Teacher Notes
The teacher notes page includes a paragraph with additional guidelines and things to think about as you begin to plan your lesson. This page also includes lines that you can use to add your own notes as you’re preparing for this lesson.
DESCRIBING NUMERICAL DATA LESSON PLAN CONTENT PAGES
Describing Numerical Data
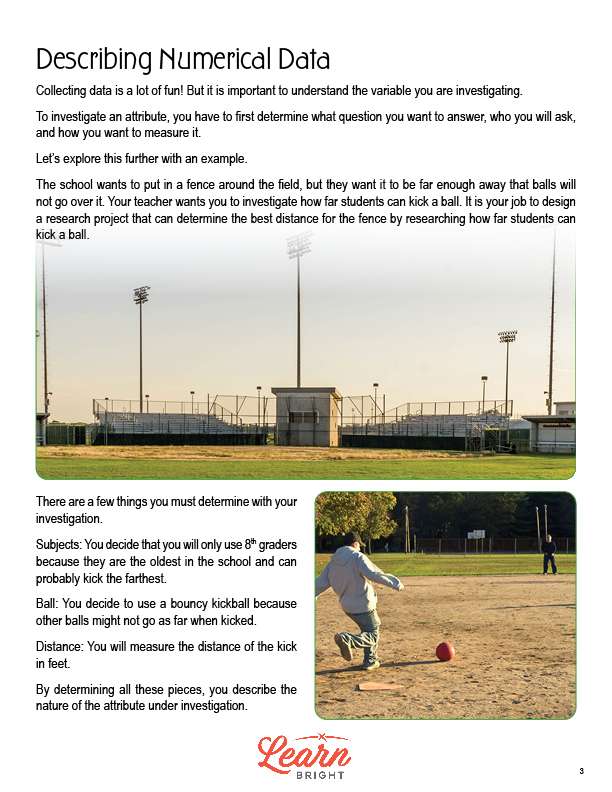
The Describing Numerical Data lesson plan includes two pages of content. It can be a lot of fun to collect data, but you need to make sure you understand what variable you’re investigating. If you want to investigate an attribute, you’ll need to decide on the question you want to answer, who you’ll ask, and how you’ll measure it.
The lesson includes an example. Say your school wants to put up a fence around a field that’s far enough away that balls won’t go over it. To decide on how far away the fence needs to be, you need to investigate how far students can kick a ball. You would need to design a research project to determine the best distance for the fence.
Before you can complete this research project, you need to determine a few things. For your subjects, you may decide to use only 8th graders because they can kick the ball the hardest. You might decide to use a bouncy ball for your kickball because they might go the farthest. Finally, you can decide to measure the distance in feet. Determining all of these things and setting these parameters will help you describe the nature of the attribute that you’re trying to investigate.
Sometimes, a research question will have a precise measurement for an answer, like if someone asks you how many pets you have. Other questions will have less precise measurements, like if someone is trying to determine the average height of a sixth grader.
We have these less precise measurements because we have imperfect conditions. Thinking of the first example, it would be very difficult to measure the exact distance that the ball travels. You might be able to get very close to the exact distance, but not the actual exact distance.
It’s important to understand the process of how you find subjects and how you conduct your data collection. These are very important when developing any research project!
DESCRIBING NUMERICAL DATA LESSON PLAN WORKSHEETS
The Describing Numerical Data lesson plan includes three worksheets: an activity worksheet, a practice worksheet, and a homework assignment. You can refer to the guide on the classroom procedure page to determine when to hand out each worksheet.
COLLECTING DATA ACTIVITY WORKSHEET
Students will work with a partner to complete the lesson activity. Each pair will pick a topic, like the number of siblings, weight of lunch boxes, or height in inches. They will then collect data for their topic and record it in the frequency table on the worksheet. Next, they will create a dot plot or bar chart for their data. Then, they will answer three questions about their data and the data collection process.
GRAPHS PRACTICE WORKSHEET
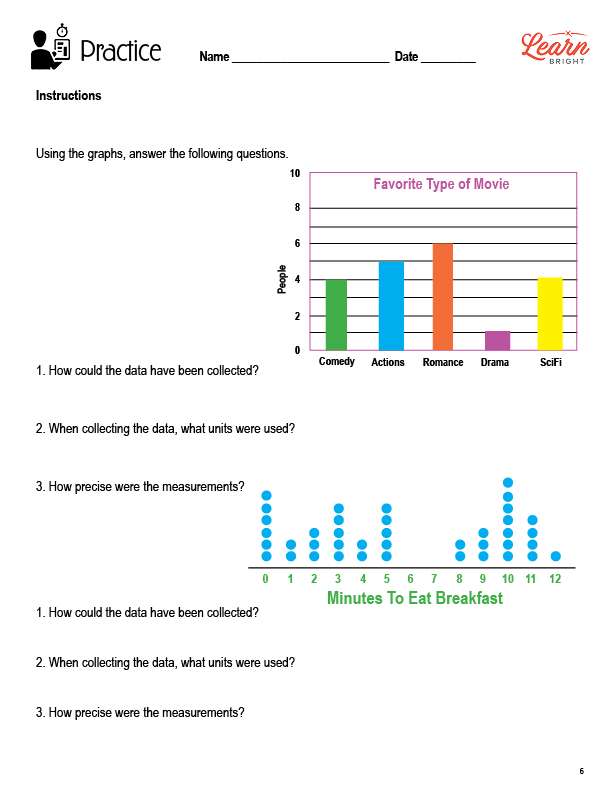
For the practice worksheet, students will use the graphs on the worksheet to answer questions.
DESCRIBING NUMERICAL DATA HOMEWORK ASSIGNMENT
Like the practice worksheet, for the homework assignment, students will use the graphs on the worksheet to answer questions.
Worksheet Answer Keys
This lesson plan includes answer keys for the activity worksheet, the practice worksheet, and the homework assignment. If you choose to administer the lesson pages to your students via PDF, you will need to save a new file that omits these pages. Otherwise, you can simply print out the applicable pages and keep these as reference for yourself when grading assignments.