
Description
What our Introduction to Graphs/Data Points lesson plan includes
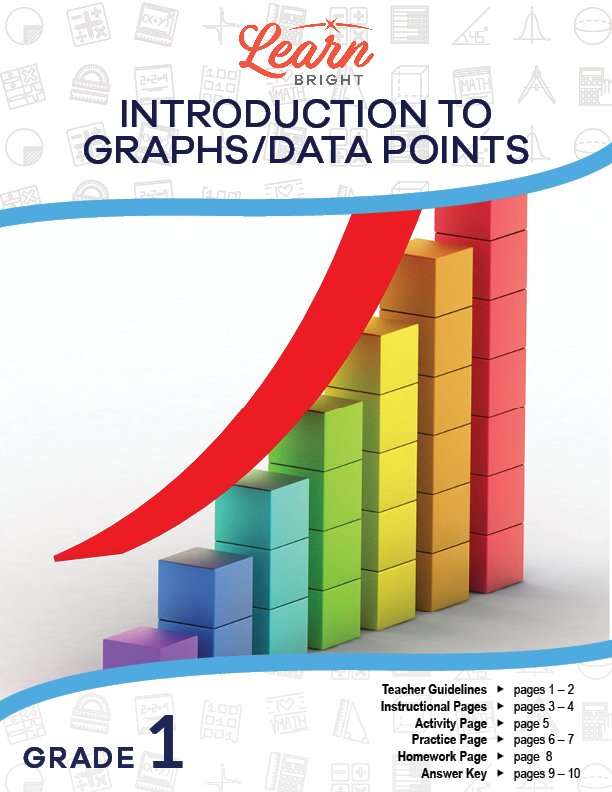
Lesson Objectives and Overview: Introduction to Graphs/Data Points teaches students the basics of how to read, create, and interpret graphs and use data points. At the end of the lesson, students will be able to organize, represent, and interpret data on a graph. This lesson is for students in 1st grade.
Classroom Procedure
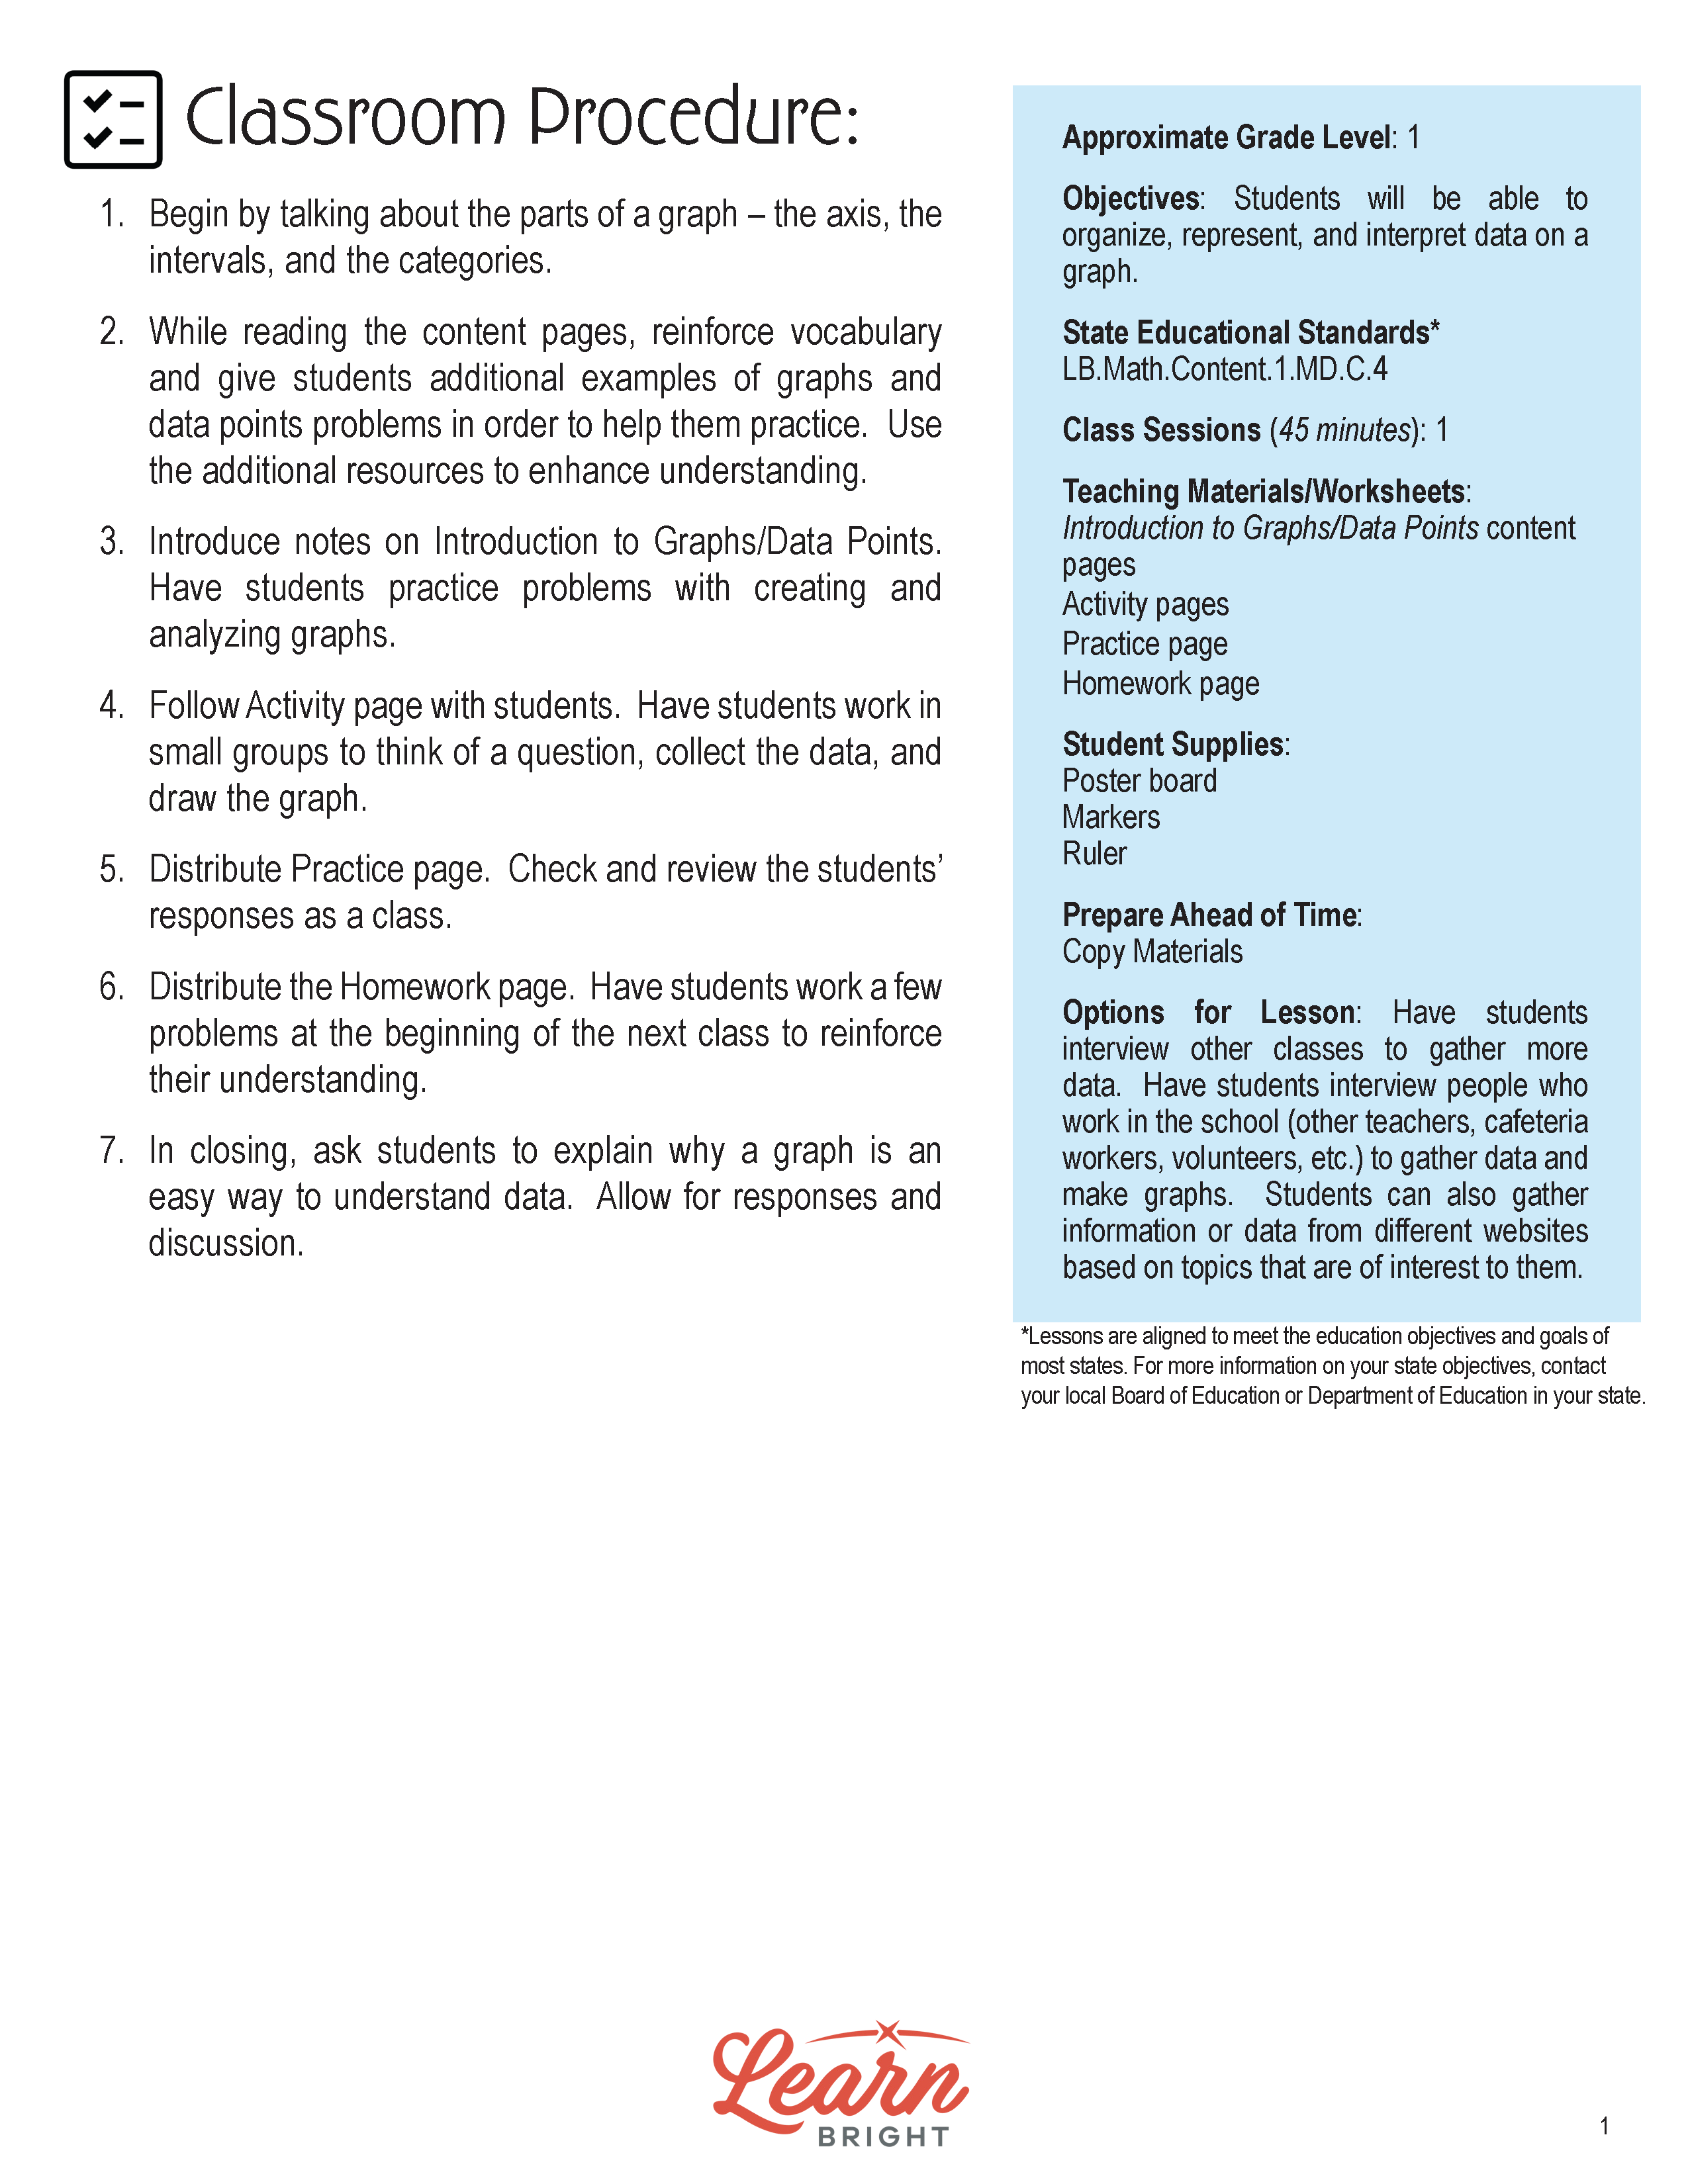
Every lesson plan provides you with a classroom procedure page that outlines a step-by-step guide to follow. You do not have to follow the guide exactly. The guide helps you organize the lesson and details when to hand out worksheets. It also lists information in the blue box that you might find useful. You will find the lesson objectives, state standards, and number of class sessions the lesson should take to complete in this area. In addition, it describes the supplies you will need as well as what and how you need to prepare beforehand. The supplies you will need for this lesson include poster board, markers, and rulers.
Options for Lesson
Included with this lesson is an “Options for Lesson” section that lists a number of suggestions for activities to add to the lesson or substitutions for the ones already in the lesson. One optional addition to this lesson is to have your students interview other classes to gather more data. They could also interview people who work in the school (other teachers, cafeteria workers, volunteers, etc.) to gather data and make graphs. Finally, you can have your students gather information or data from different websites based on topics that are of interest to them.
Teacher Notes
The teacher notes page includes a paragraph with additional guidelines and things to think about as you begin to plan your lesson. This page also includes lines that you can use to add your own notes as you’re preparing for this lesson.
INTRODUCTION TO GRAPHS/DATA POINTS LESSON PLAN CONTENT PAGES
Introduction to Graphs and Data Points
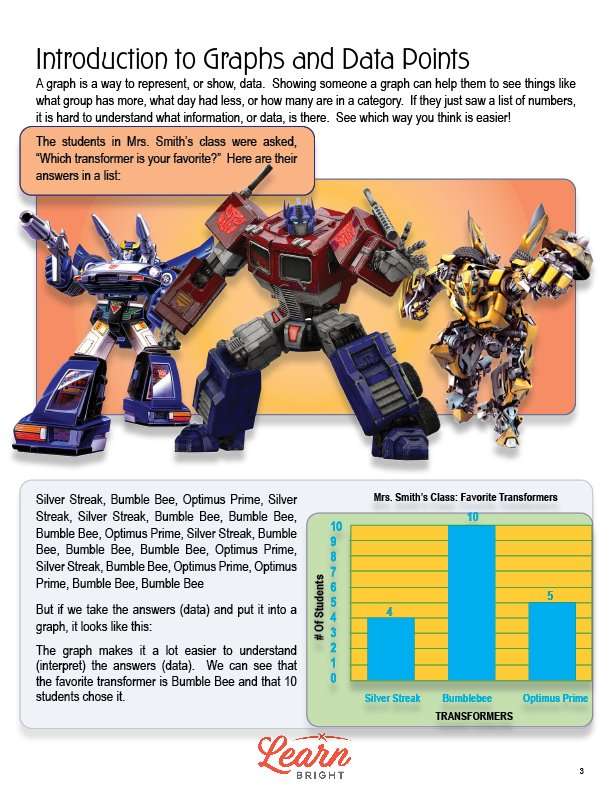
The Introduction to Graphs/Data Points lesson plan includes two content pages. Graphs are a great way to represent data. Graphs can give people all kinds of information in a way that’s easier to understand than just looking at a list of numbers.
The lesson includes an example to showcase this. Say your teacher asked their class which Transformer was their favorite. Would it be easier to look at a long list of different names of Transformers, some of which were the same, or a bar chart that shows how many people said each Transformer was their favorite? The graph is easier, of course!
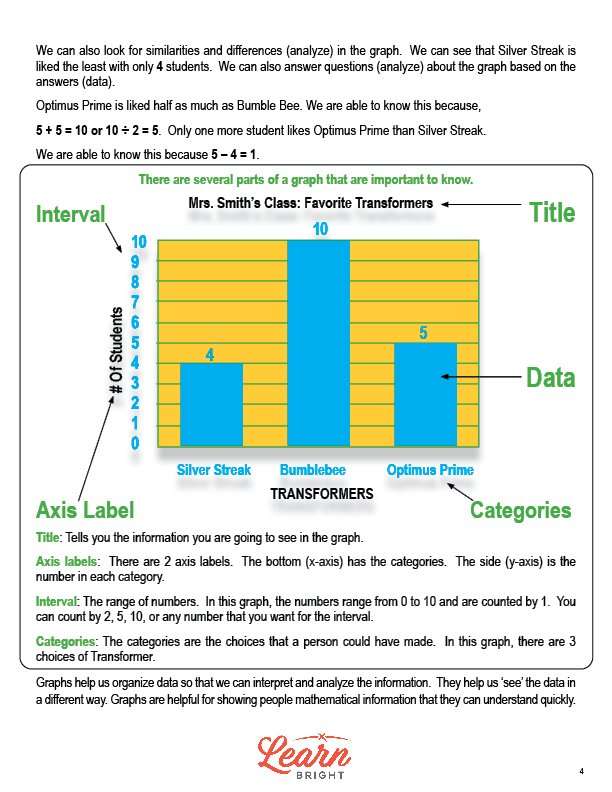
With a graph, we can both organize and interpret information. For example, if you looked at the graph of favorite Transformers, you can easily determine which Transformer is the most popular among the students in the class. When you look at the graph, you can see that Silver Streak is the least popular with only four students, and that Optimus Prime is liked half as much as Bumble Bee.
It’s important to understand the different parts of a graph as well. First, the title tells you what information the graph includes. The bottom axis label (the x-axis) tells you the categories that are shown on the graph, while the side axis label (the y-axis) tells you the number in each category. Next, the interval, shown along the side of the graph, shows you the range of numbers and what interval they’re counted by; you can count by 1, 2, 5, 10, or any other number that you want for the interval! Finally, the categories listed along the x-axis are the choices that a person could have made. In the example graph, there are three choices: Silver Streak, Bumblebee, and Optimus Prime.
Graphs are a helpful way to organize data so that we can interpret and analyze it. They help us visualize the data. They are very useful when you want to understand mathematical information quickly and easily!
INTRODUCTION TO GRAPHS/DATA POINTS LESSON PLAN WORKSHEETS
The Introduction to Graphs/Data Points lesson plan includes three worksheets: an activity worksheet, a practice worksheet, and a homework assignment. You can refer to the guide on the classroom procedure page to determine when to hand out each worksheet.
CLASS CHARTS ACTIVITY WORKSHEET
The activity worksheet asks students to work in groups to create charts about their class. Each group will ask the class a question, collect their data, and create a graph to show their data.
GRAPHS PRACTICE WORKSHEET
For the practice worksheet, students will answer questions about different graphs.
INTRODUCTION TO GRAPHS/DATA POINTS PRACTICE WORKSHEET
The homework assignment asks students to create a graph using a specific prompt.
Worksheet Answer Keys
This lesson plan includes answer keys for the practice worksheet and the homework assignment. If you choose to administer the lesson pages to your students via PDF, you will need to save a new file that omits these pages. Otherwise, you can simply print out the applicable pages and keep these as reference for yourself when grading assignments.