


Description
What our Box and Whiskers lesson plan includes
Lesson Objectives and Overview: Box and Whiskers introduces students to box and whiskers graphs, which are a simple, linear way to analyze sets of continuous numerical data. They are especially helpful in determining whether or not there are significant differences between sets of data, showing the distribution of data along a number line. At the end of the lesson, students will be able to display numerical data in box plots and analyze multiple box plots. This lesson is for students in 6th grade.
Classroom Procedure
Every lesson plan provides you with a classroom procedure page that outlines a step-by-step guide to follow. You do not have to follow the guide exactly. The guide helps you organize the lesson and details when to hand out worksheets. It also lists information in the blue box that you might find useful. You will find the lesson objectives, state standards, and number of class sessions the lesson should take to complete in this area. In addition, it describes the supplies you will need as well as what and how you need to prepare beforehand.
Options for Lesson
Included with this lesson is an “Options for Lesson” section that lists a number of suggestions for activities to add to the lesson or substitutions for the ones already in the lesson. One optional addition to this lesson is to have your students collect data from a class made survey and create box and whisker plots to display the data. You could also have your students work in groups to develop questions and poll students in the school. Another idea is to have your students throw a ball and record distances or shoot water guns to create data to make plots–there are so many fun ways to collect data (jumps, heartbeats, push-ups in a minute)!
Teacher Notes
The teacher notes page includes lines that you can use to add your own notes as you’re preparing for this lesson.
BOX AND WHISKERS LESSON PLAN CONTENT PAGES
Box and Whiskers
The Box and Whiskers lesson plan includes four pages of content. Box and Whiskers graphs can help you analyze sets of continuous numerical data in a simple and linear way. They can help you determine whether or not the sets of data have significant differences.
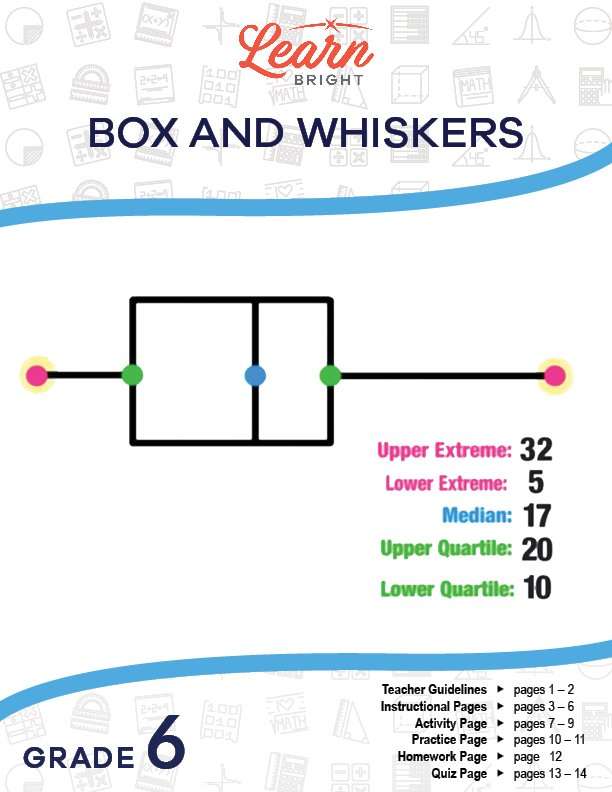
Box and whiskers graphs illustrate the distribution of data along a number line. Box and whiskers graphs have four components: two whiskers and two boxes. Each of these components makes up 25% of the data, no matter how small or large they are.
These graphs help display the distribution of data based on a five-number summary. This consists of the minimum, first quartile, median, third quartile, and maximum. We make the five-number summary with the five components. The lower extreme (also called the minimum) is the smallest number in the set of data. The lower quartile (also called Q1) is the median of the lower set of numbers. Next, the median (also called Q2) is the value exactly in the middle of an ordered set of numbers. The upper quartile (also called Q3) is the median of the upper set of numbers 5. Finally, the upper extreme (also called the maximum) is the largest number in the set of data.
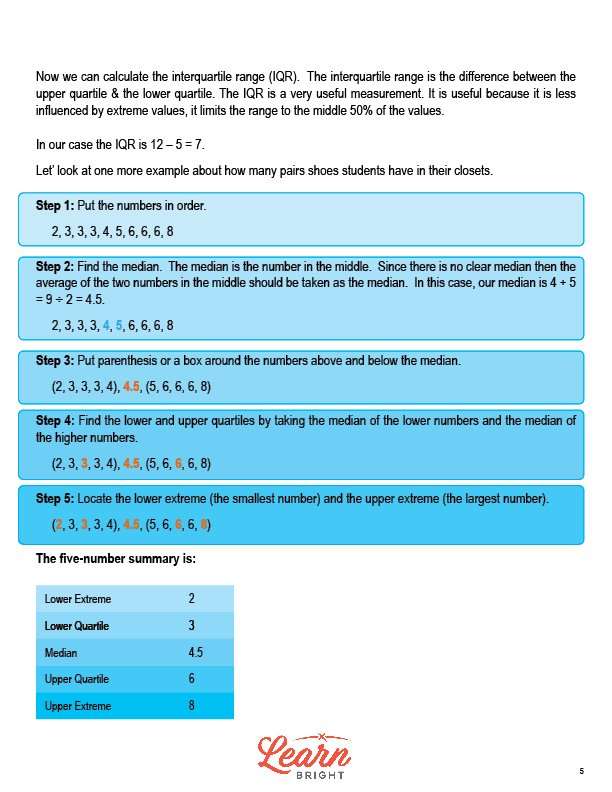
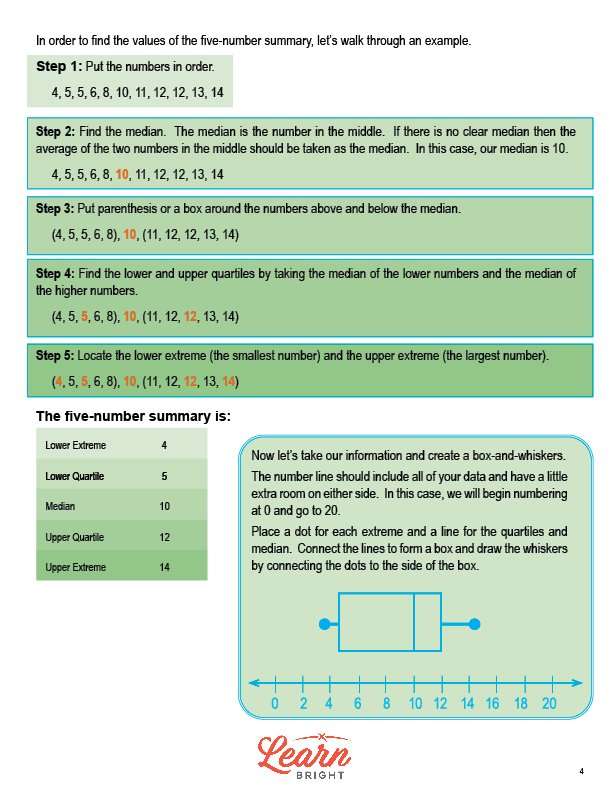
The lesson then walks students through an example problem to show them the steps you need to follow to find the values of a five-number summary. First, you put the numbers in order. Next, you find the median (the number in the middle). Some data sets don’t have a clear median, in which case you average the two numbers in the median. Next, you put parenthesis or a box around the numbers above and below the median. Then, find the lower and upper quartiles by taking the median of the lower numbers and the median of the higher numbers. Finally, find the lower extreme (the smallest number) and the upper extreme (the largest number).
We can then take this information and use it to create a box and whiskers graph. The number line includes all of your data and leaves a little bit of room on both sides. We place a dot for each extreme and a line for the quartiles and median and then connect the lines to form a box. We draw the whiskers by connecting the dots and the side of the box.
Next, we calculate the interquartile range (IQR). This is the difference between upper and lower quartiles. This is a useful measurement because it’s less influenced by extreme values. It limits the range to the middle 50% of the values.
The lesson then includes another example problem that walks students through the steps to create a five-number summary, create a box and whiskers graph, and calculate the IQR.
BOX AND WHISKERS LESSON PLAN WORKSHEETS
The Box and Whiskers lesson plan includes four worksheets: an activity worksheet, a practice worksheet, a homework assignment, and a quiz. You can refer to the guide on the classroom procedure page to determine when to hand out each worksheet.
Xs AND Os WORKSHEET
The activity worksheet asks each student to see how many x’s they can write in a given row of o’s in ten seconds. Each student will write their data on the board and then rewrite the class data in rank order from lowest to highest. As a class, they will then identify the five-point summary and decide on a number line that spans all of the values. They will draw a box and whiskers. They will then repeat the exercise using their non-dominant hand.
BOX AND WHISKERS PRACTICE WORKSHEET
For the practice worksheet, students will use the given data to draw box and whiskers plots using the five-number summary.
RESTAURANTS HOMEWORK ASSIGNMENT
For the homework assignment, students will compare the calories and fat in the burgers and sandwiches at different fast food restaurants. They will then use box and whiskers to determine the healthier choices available. They will complete assignment the in three parts. In the first part, they will collect data on calories in different burgers and create box and whiskers for each on graph paper. In the second, they will do the same for the fat content. Finally, in the third, they will analyze the data and answer questions about their findings.
QUIZ
This lesson also includes a quiz that you can use to test students’ understanding of the lesson material. For the quiz, students will find the five-number summary and draw the box and whiskers plot.
Worksheet Answer Keys
This lesson plan includes answer keys for the practice worksheet, the homework assignment, and the quiz. If you choose to administer the lesson pages to your students via PDF, you will need to save a new file that omits these pages. Otherwise, you can simply print out the applicable pages and keep these as reference for yourself when grading assignments.