


Description
What our Fractions and Line Plots lesson plan includes
Lesson Objectives and Overview: Fractions and Line Plots introduces students to strategies for displaying and understanding data with fractions on line plots. At the end of the lesson, students will be able to organize, interpret, and display data with fractions on a line plot. This lesson is for students in 5th grade and 6th grade.
Classroom Procedure
Every lesson plan provides you with a classroom procedure page that outlines a step-by-step guide to follow. You do not have to follow the guide exactly. The guide helps you organize the lesson and details when to hand out worksheets. It also lists information in the blue box that you might find useful. You will find the lesson objectives, state standards, and number of class sessions the lesson should take to complete in this area. In addition, it describes the supplies you will need as well as what and how you need to prepare beforehand.
Options for Lesson
Included with this lesson is an “Options for Lesson” section that lists a number of suggestions for activities to add to the lesson or substitutions for the ones already in the lesson. One optional addition to this lesson is to have your students generate questions for a line plot that involves fractions such as shoe size or length of their backpack. You could also grow plants in your classroom and measure them every two days to collect data for line plots that change over time. Finally, use a portion of the class to review fractions and number lines.
Teacher Notes
The teacher notes page includes lines that you can use to add your own notes as you’re preparing for this lesson.
FRACTIONS AND LINE PLOTS LESSON PLAN CONTENT PAGES
Fractions and Line Plots
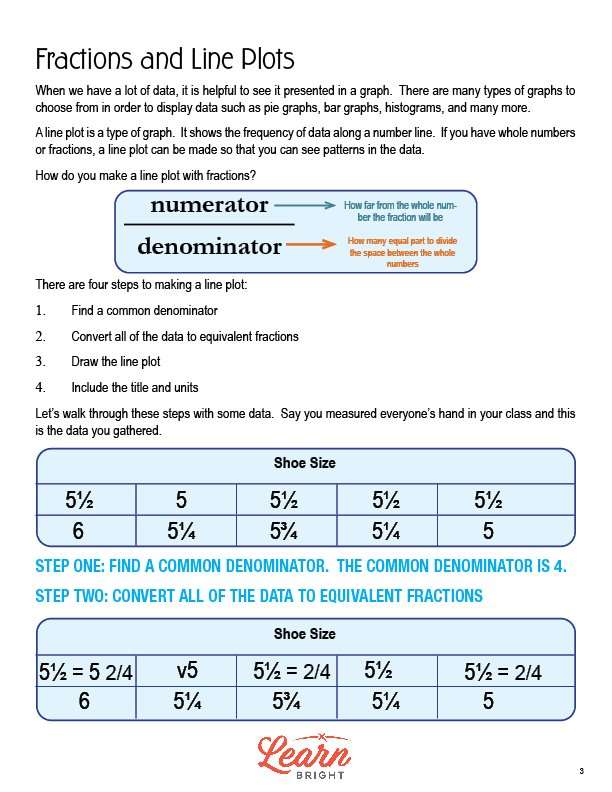
The Fractions and Line Plots lesson plan includes two pages of content. It can be helpful to see data presented in a graph, especially when there’s a lot of it. There are many different kinds of graphs that can display different kinds of data, including pie graphs, bar graphs, histograms, and more.
Line plots are one type of graph that shows the frequency of data on a number line. You can create a line plot using whole numbers or fractions. These help see patterns in the data. But how do you make a line plot with fractions?
Start by identifying the numerator and denominator. The numerator tells you how far from the whole number the fraction will be, and the denominator tells you how many equal parts to divide the space between the whole numbers by.
It takes four steps to create a line plot. First, find a common denominator. Second, convert the data to equivalent fractions. Third, draw the line plot. Fourth, include the title and units.
Example
The lesson walks through these steps with some example data. The example shows students’ shoe sizes: 5 1/2, 5, 5 1/2, 5 1/2, 5 1/2, 6, 5 1/4, 5 3/4, 5 1/4, and 5. The first step is to find a common denominator. For this data, the common denominator is 4.
The second step is to convert all of the data to equivalent fractions. All of the 5 1/2 shoe sizes become 5 2/4. The rest of the fractions stay the same.
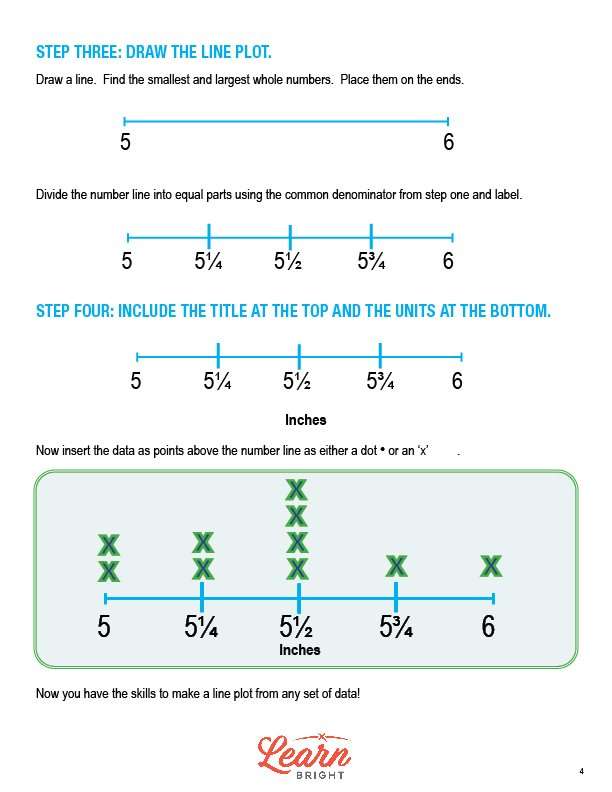
The third step is to draw the line plot. Start by drawing a line and finding the smallest and largest whole numbers (5 and 6 in this example). Place those numbers on the ends of the number line. Next, divide the number line into equal parts using the common denominator from the first step. Label each part.
The fourth step is to write a title at the top and the units at the bottom. Finally, insert the data as points above the number line as either a dot or an x. This shows you the distribution of the data!
FRACTIONS AND LINE PLOTS LESSON PLAN WORKSHEETS
The Fractions and Line Plots lesson plan includes four worksheets: an activity worksheet, a practice worksheet, a homework assignment, and a quiz. You can refer to the guide on the classroom procedure page to determine when to hand out each worksheet.
COIN FLIPS ACTIVITY WORKSHEET
For the activity worksheet, students will flip a coin four times and write down the data (heads or tails) in the chart on the worksheet. They will answer some questions about their data. Finally, they will cut out and color in the big X on the worksheet and then place it on the correct spot on a line plot representing the data from the whole class.
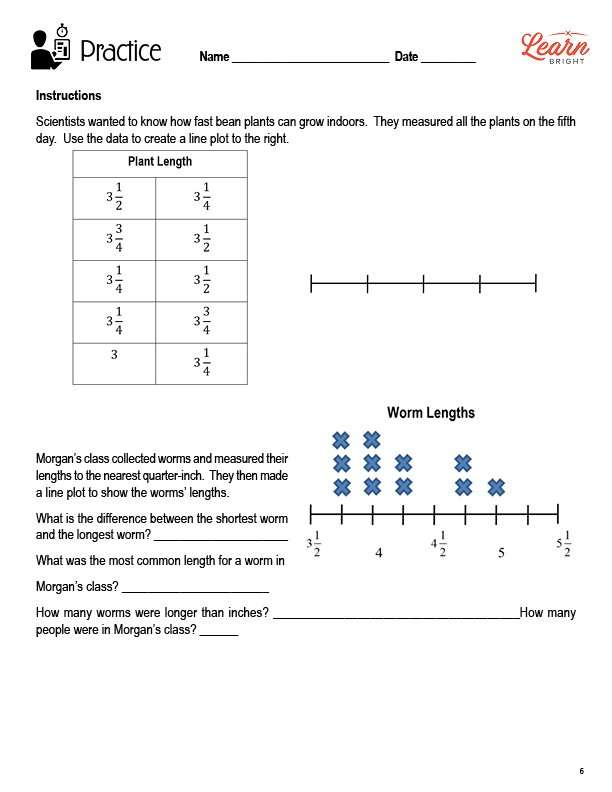
BEAN PLANTS PRACTICE WORKSHEET
The practice worksheet asks students to look at sample data showing the growth of bean plants indoors. The students will use the data to create a line plot. They will also look at a line plot showing the lengths of different worms and answer questions about the data based on the line plot.
FRACTIONS AND LINE PLOTS HOMEWORK ASSIGNMENT
For the homework assignment, students will find 10 different pens or pencils and measure them, recording their lengths in the chart on the worksheet. They will then use that data to create a line plot.
QUIZ
This lesson also includes a quiz that you can use to test students’ understanding of the lesson material. For the quiz, students will create a line plot based on the data in the chart on the worksheet.
Worksheet Answer Keys
This lesson plan includes answer keys for the practice worksheet and the quiz. If you choose to administer the lesson pages to your students via PDF, you will need to save a new file that omits these pages. Otherwise, you can simply print out the applicable pages and keep these as reference for yourself when grading assignments.