Description
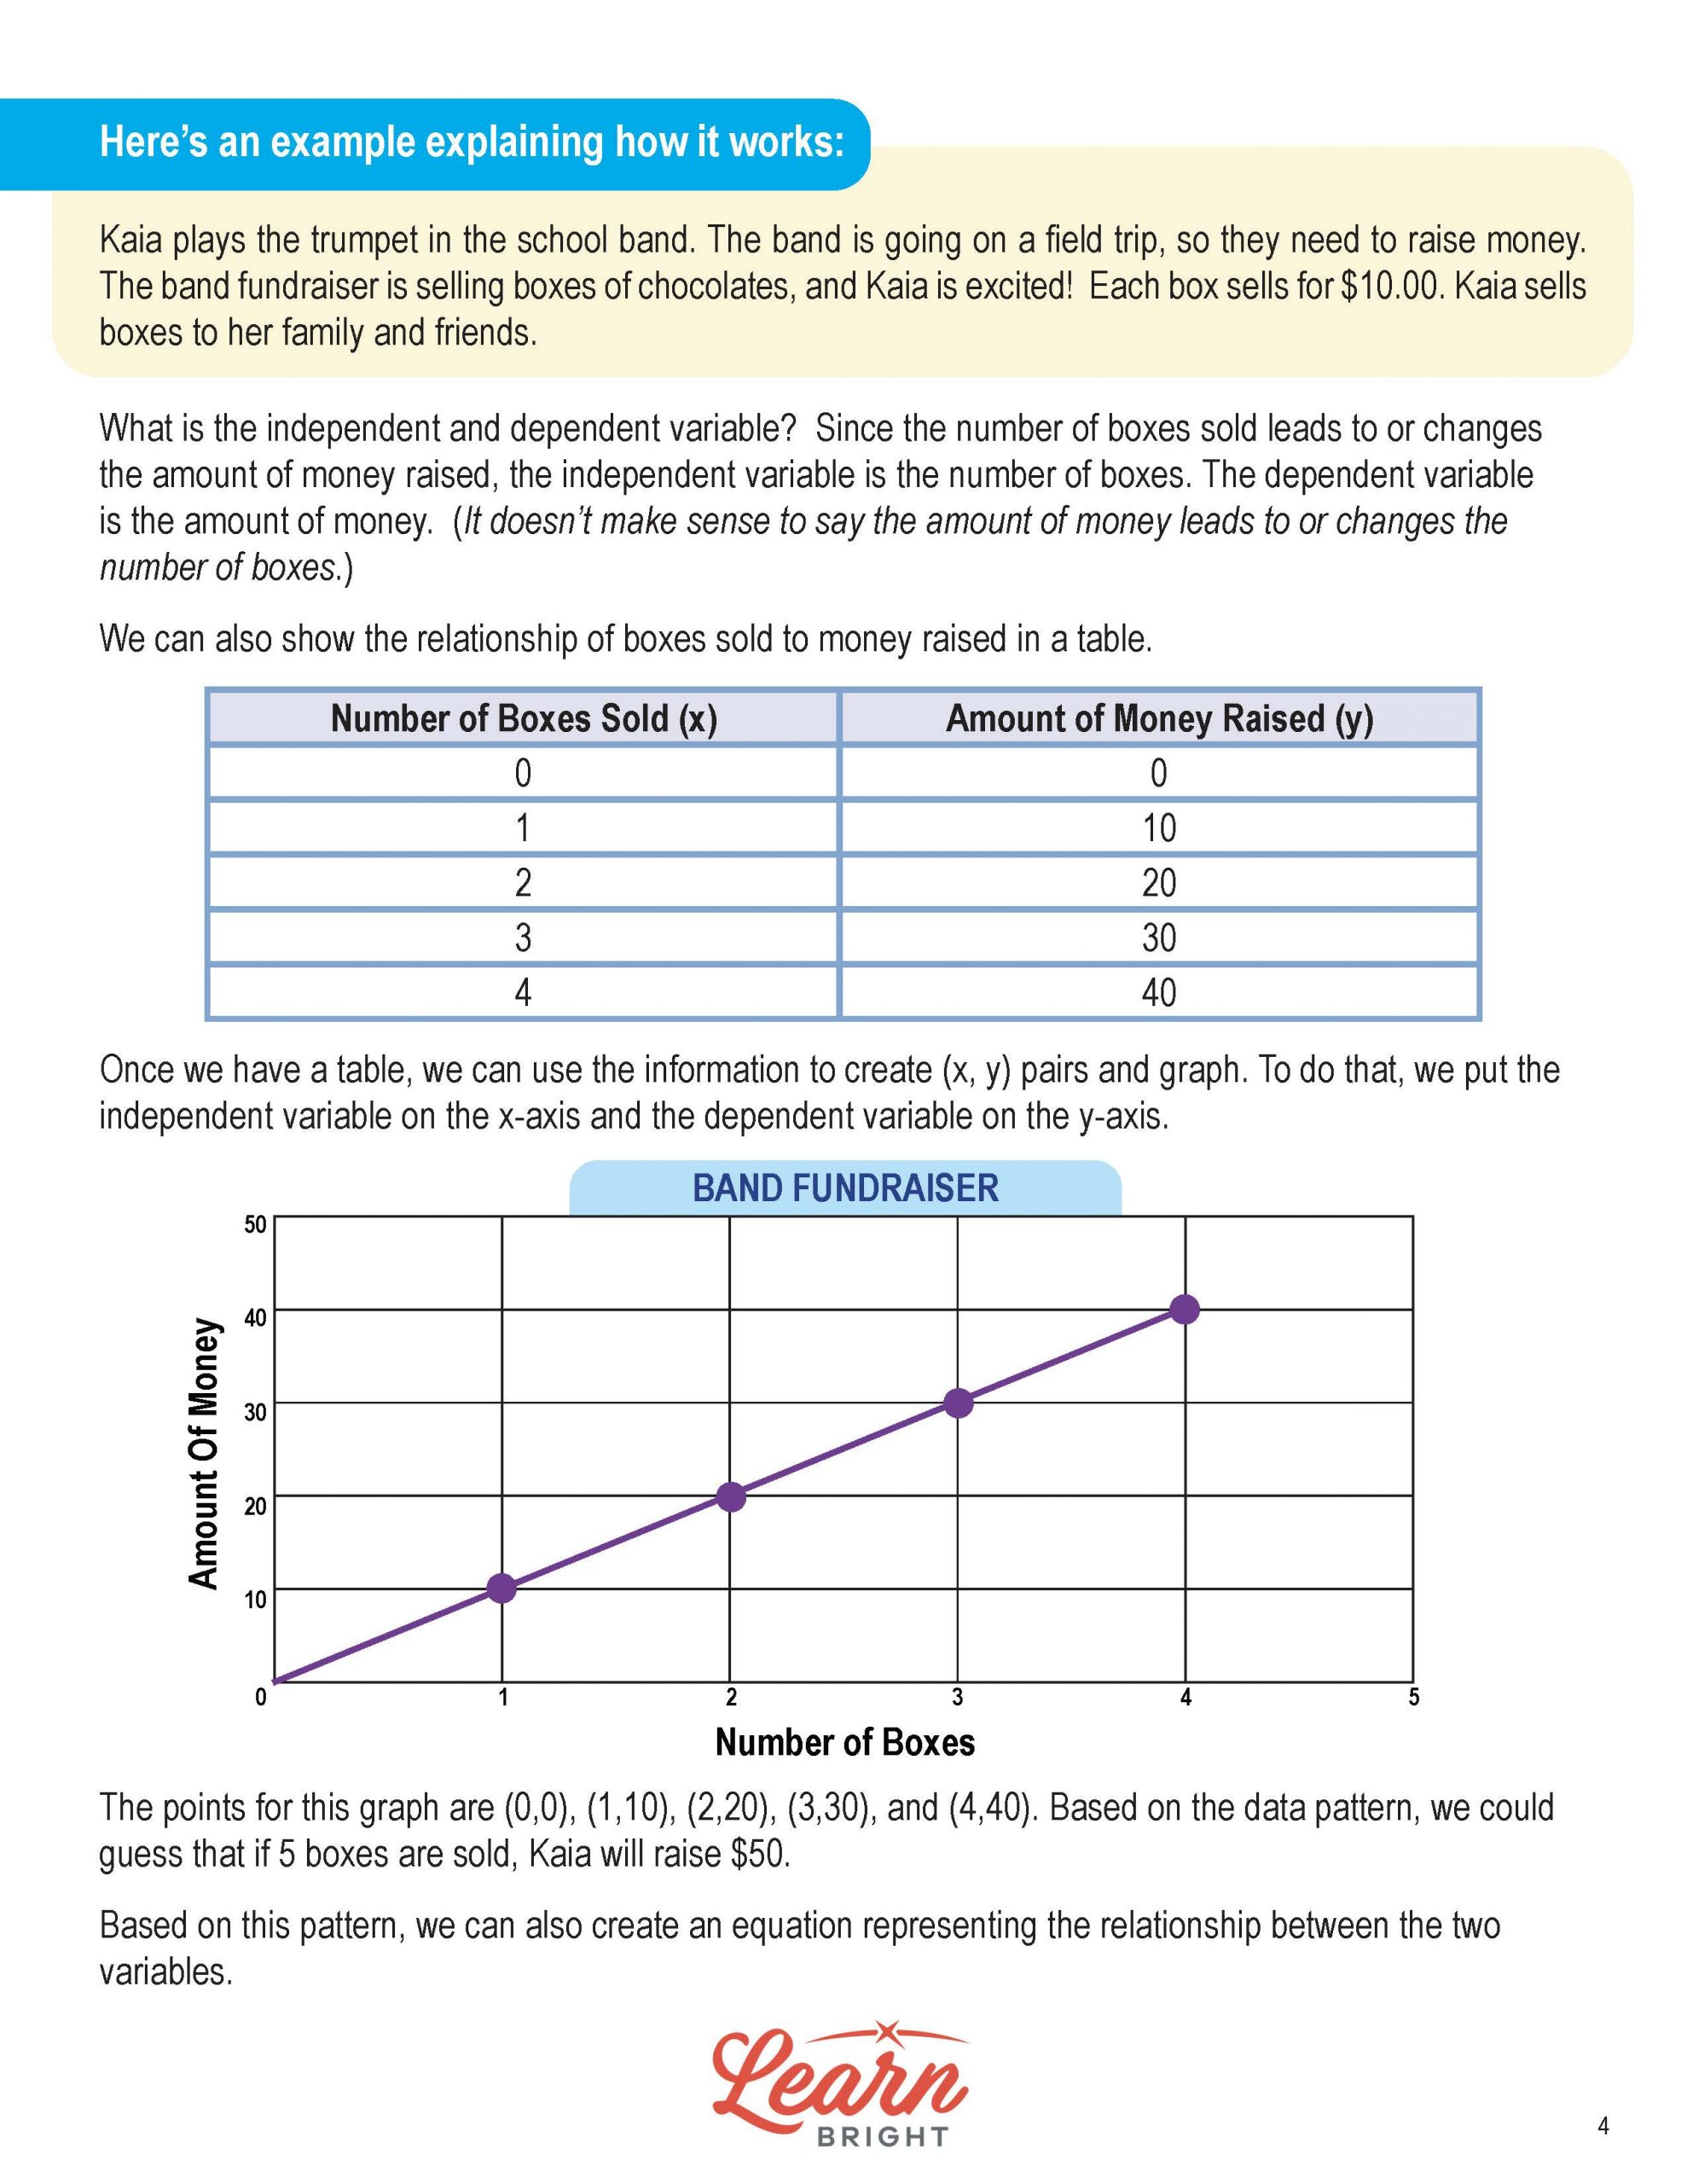
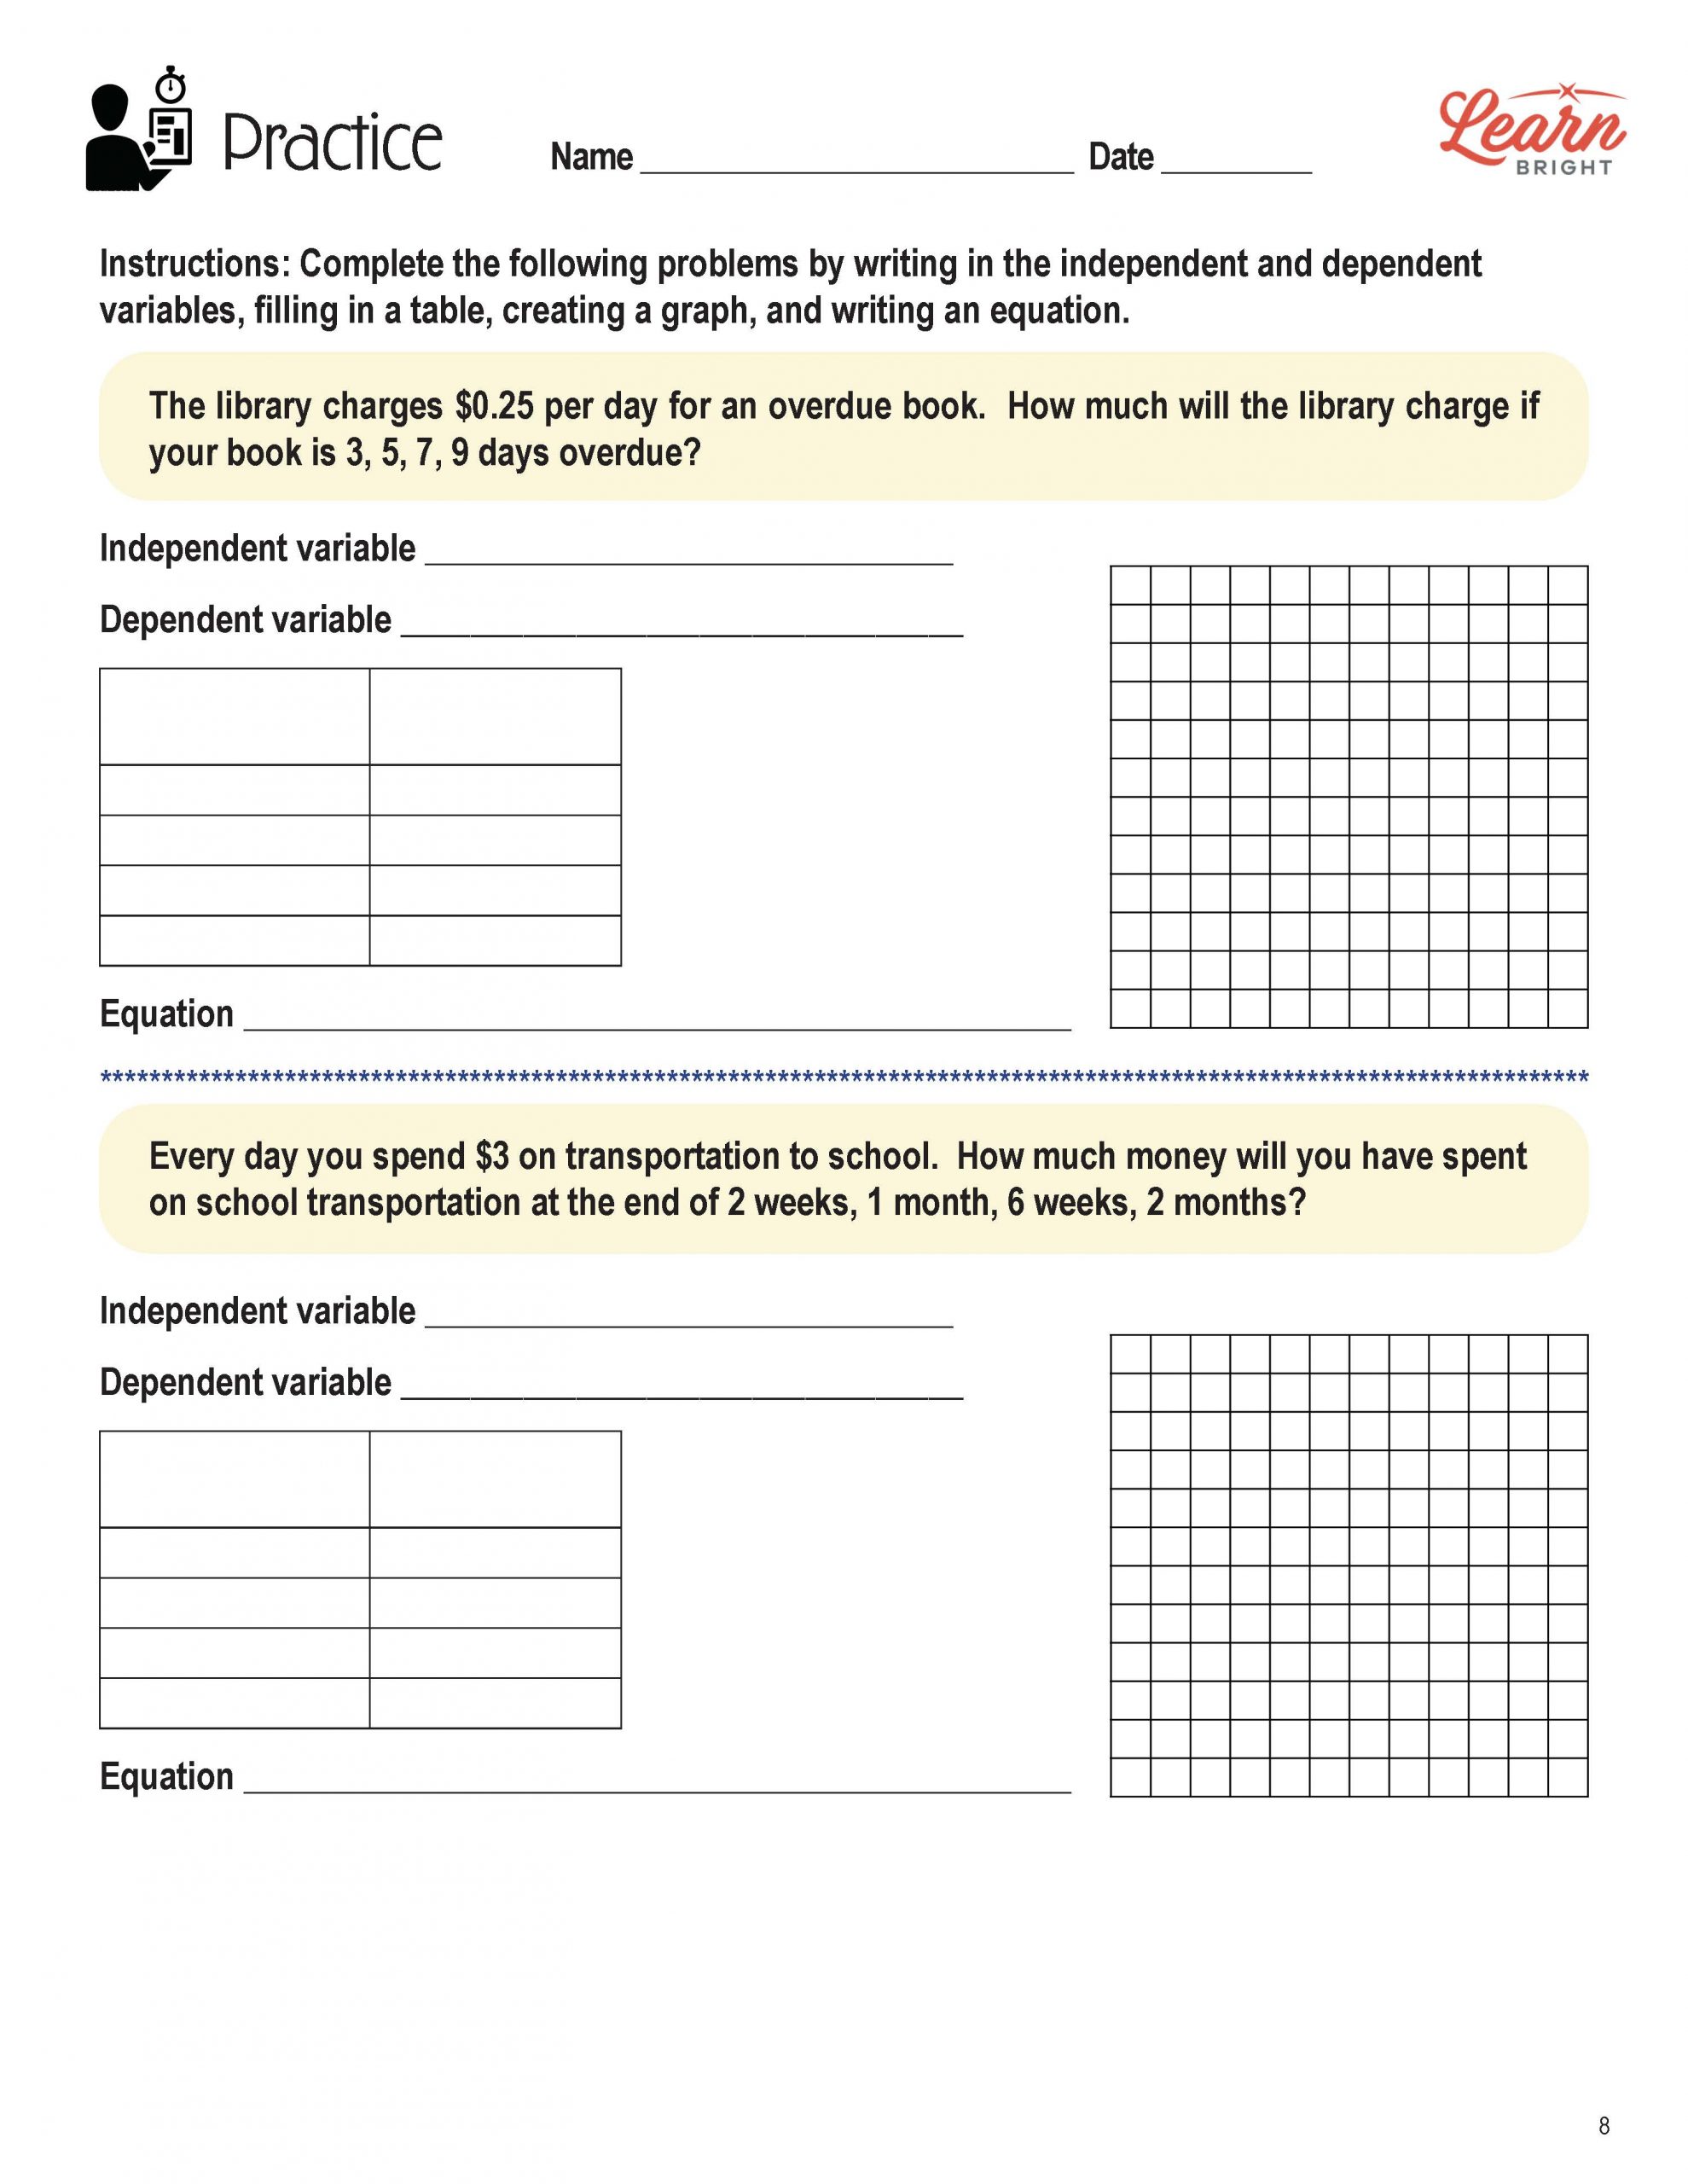
In this advanced lesson plan, students will learn how to use statistics to prove a point of view. First, they will identify the independent and dependent variables in a statistical question. Then, they will construct a table and use the x-y pairs to create a graph. Finally, they will develop an equation representing the relationship. Throughout the lesson, students will collect data by bouncing tennis balls from different heights. By the end of the lesson, they will be able to mathematically display their data in an engaging and persuasive way.

